Observability Best Practices when running FastAPI in a Lambda
Serverless makes it incredibly easy to get an API up and running in record time. But how do you achieve a high level of observability in a distributed architecture? In this post, we will be looking at instrumenting logging, metrics, and tracing capabilities for a FastAPI application using AWS Lambda Powertools for Python.
Note
This guide assumes that you know how to build and deploy a SAM application using the AWS SAM CLI. If you need a refresher on that, please refer to my previous blog post.
What is observability?
The rise of cloud and serverless computing has made a big impact on how we build, scale, and manage applications. Developers can now independently build and deploy applications with unmatched agility and speed. With distributed applications becoming more and more common, we must take care to not lose observability in our systems and services. Before long, we will get to a point where a single request traverses our architecture through any number of functions, containers, queues, and other services.
By implementing best practices when it comes to logging and metrics, as well as being able to trace a request through the entire system, we can gain a better understanding of how our applications are performing. The goal of observability is to instrument our applications so that when an issue occurs somewhere in our distributed system, we can quickly locate the root cause of the issue. Good observability also gives great insights into how our applications and services are being used, valuable insights that can guide future business decisions.
Observability can be achieved in several ways, and in this article you will learn how to instrument a FastAPI application, running inside a Lambda function, using the AWS Lambda Powertools for Python library. We will focus on implementing three different capabilities in our application.
- Structured Logging where we add contextual information to logs, such as request and correlation IDs, Lambda and FastAPI context, service name, exception information, and more.
- Metrics so that we can track how our application is used and how it is performing.
- Tracing so that we can trace requests as they travel through our systems.
Sample FastAPI Application
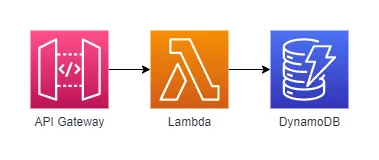
In this example we will use a simple FastAPI application, a Pets API that allows you to add, remove, list, fetch and update pets that are stored in DynamoDB. We will use a REST API Gateway to act as a proxy in front of the application.
Note
As shown in the AWS Docs, HTTP APIs do not (at the time of writing) support tracing with AWS X-ray, which is why we have to use a REST API instead.
To start, we will need the following files (they are also available on GitHub):
example/ src/ requirements.txt app/ __init__.py dynamo.py models.py template.yml samconfig.tomlexample/samconfig.toml
version = 0.1
[default.global.parameters]stack_name = "FastAPIPowerToolsExample" # or whatever you'd like
[default.deploy][default.deploy.parameters]confirm_changeset = falsecapabilities = "CAPABILITY_IAM"s3_prefix = "fastapi-powertools" # or whatever you'd likeregion = "eu-west-1" # or whichever region you preferexample/template.yml
AWSTemplateFormatVersion: '2010-09-09'Transform: AWS::Serverless-2016-10-31Description: FastAPI Lambda PowerTools Example
Resources: Table: Type: AWS::Serverless::SimpleTable Properties: PrimaryKey: Name: 'id' Type: String
Function: Type: AWS::Serverless::Function Properties: MemorySize: 128 CodeUri: src Handler: app.handler Runtime: python3.9 Policies: - DynamoDBCrudPolicy: TableName: !Ref Table Environment: Variables: TABLE_NAME: !Ref Table Events: DefaultEndpoint: Type: Api Properties: RestApiId: !Ref RestApi Path: /{proxy+} Method: ANY
RestApi: Type: AWS::Serverless::Api Properties: StageName: Prod
Outputs: ApiUrl: Description: URL of the API Value: Fn::Sub: 'https://${RestApi}.execute-api.${AWS::Region}.${AWS::URLSuffix}/Prod'example/src/requirements.txt
mangumfastapiboto3pydanticexample/src/app/__init__.py
from fastapi import FastAPI, HTTPException
from mangum import Mangumfrom . import dynamo, models
app = FastAPI()
@app.get("/")def get_root(): return {"message": "Hello World"}
@app.get("/pets", response_model=models.PetListResponse)def list_pets(next_token: str = None): return dynamo.list_pets(next_token)
@app.get("/pets/{pet_id}", response_model=models.PetResponse)def get_pet(pet_id: str): try: return dynamo.get_pet(pet_id) except dynamo.PetNotFoundError: raise HTTPException(status_code=404, detail="Pet not found")
@app.post("/pets", status_code=201, response_model=models.PetResponse)def post_pet(payload: models.CreatePayload): res = dynamo.create_pet(kind=payload.kind, name=payload.name) return res
@app.patch("/pets/{pet_id}", status_code=204)def update_pet(pet_id: str, payload: models.UpdatePayload): try: return dynamo.update_pet( pet_id=pet_id, kind=payload.kind, name=payload.name, ) except dynamo.PetNotFoundError: raise HTTPException(status_code=404, detail="Pet not found")
@app.delete("/pets/{pet_id}", status_code=204)def delete_pet(pet_id: str): try: dynamo.delete_pet(pet_id) except dynamo.PetNotFoundError: raise HTTPException(status_code=404, detail="Pet not found")
handler = Mangum(app)example/src/app/dynamo.py
import osimport jsonimport base64from uuid import uuid4import boto3from boto3.dynamodb.conditions import Attr
table = boto3.resource("dynamodb").Table(os.environ["TABLE_NAME"])
class Error(Exception): pass
class PetNotFoundError(Error): pass
def create_pet(kind: str, name: str) -> dict: print("Creating pet")
pet_id = str(uuid4()) item = { "id": pet_id, "kind": kind, "name": name, } table.put_item(Item=item) return item
def get_pet(pet_id: str) -> dict: print("Getting pet") res = table.get_item( Key={ "id": pet_id, }, )
item = res.get("Item") if not item: raise PetNotFoundError
return item
def update_pet(pet_id: str, kind: str = None, name: str = None): expr = [] attr_values = {} attr_names = {}
if kind is not None: expr.append("#K=:k") attr_values[":k"] = kind attr_names["#K"] = "kind"
if name is not None: expr.append("#N=:n") attr_values[":n"] = name attr_names["#N"] = "name"
if not expr: print("No fields to update") return
print("Updating pet") try: table.update_item( Key={ "id": pet_id, }, UpdateExpression=f"set {', '.join(expr)}", ExpressionAttributeValues=attr_values, ExpressionAttributeNames=attr_names, ConditionExpression=Attr("id").exists(), ) except table.meta.client.exceptions.ConditionalCheckFailedException: raise PetNotFoundError
def list_pets(next_token: str = None) -> dict: print("Listing pets")
scan_args = { "Limit": 10, }
if next_token: scan_args["ExclusiveStartKey"] = _decode(next_token)
res = table.scan(**scan_args) response = {"pets": res["Items"]}
if "LastEvaluatedKey" in res: response["next_token"] = _encode(res["LastEvaluatedKey"])
return response
def delete_pet(pet_id: str): print("Deleting pet")
try: table.delete_item( Key={ "id": pet_id, }, ConditionExpression=Attr("id").exists(), ) except table.meta.client.exceptions.ConditionalCheckFailedException: raise PetNotFoundError
def _encode(data: dict) -> str: json_string = json.dumps(data) return base64.b64encode(json_string.encode("utf-8")).decode("utf-8")
def _decode(data: str) -> dict: json_string = base64.b64decode(data.encode("utf-8")).decode("utf-8") return json.loads(json_string)example/src/app/models.py
from pydantic import BaseModelfrom typing import Optional
class PetResponse(BaseModel): id: str name: str kind: str
class CreatePayload(BaseModel): name: str kind: str
class UpdatePayload(BaseModel): name: Optional[str] kind: Optional[str]
class PetListResponse(BaseModel): pets: list[PetResponse] next_token: str = NoneChecking the baseline
Before we add more advanced features to the application, let’s deploy the API in its current state to establish a baseline. While testing the API, I have used this Python script. The script uses boto3 to fetch the API URL from the CloudFormation Stack outputs. It then runs a sequence of requests towards the API, touching all the endpoints. You could also issue requests with cURL, through the Swagger UI available at https://API_URL/STAGE/docs, or with something like Postman. The choice is yours.
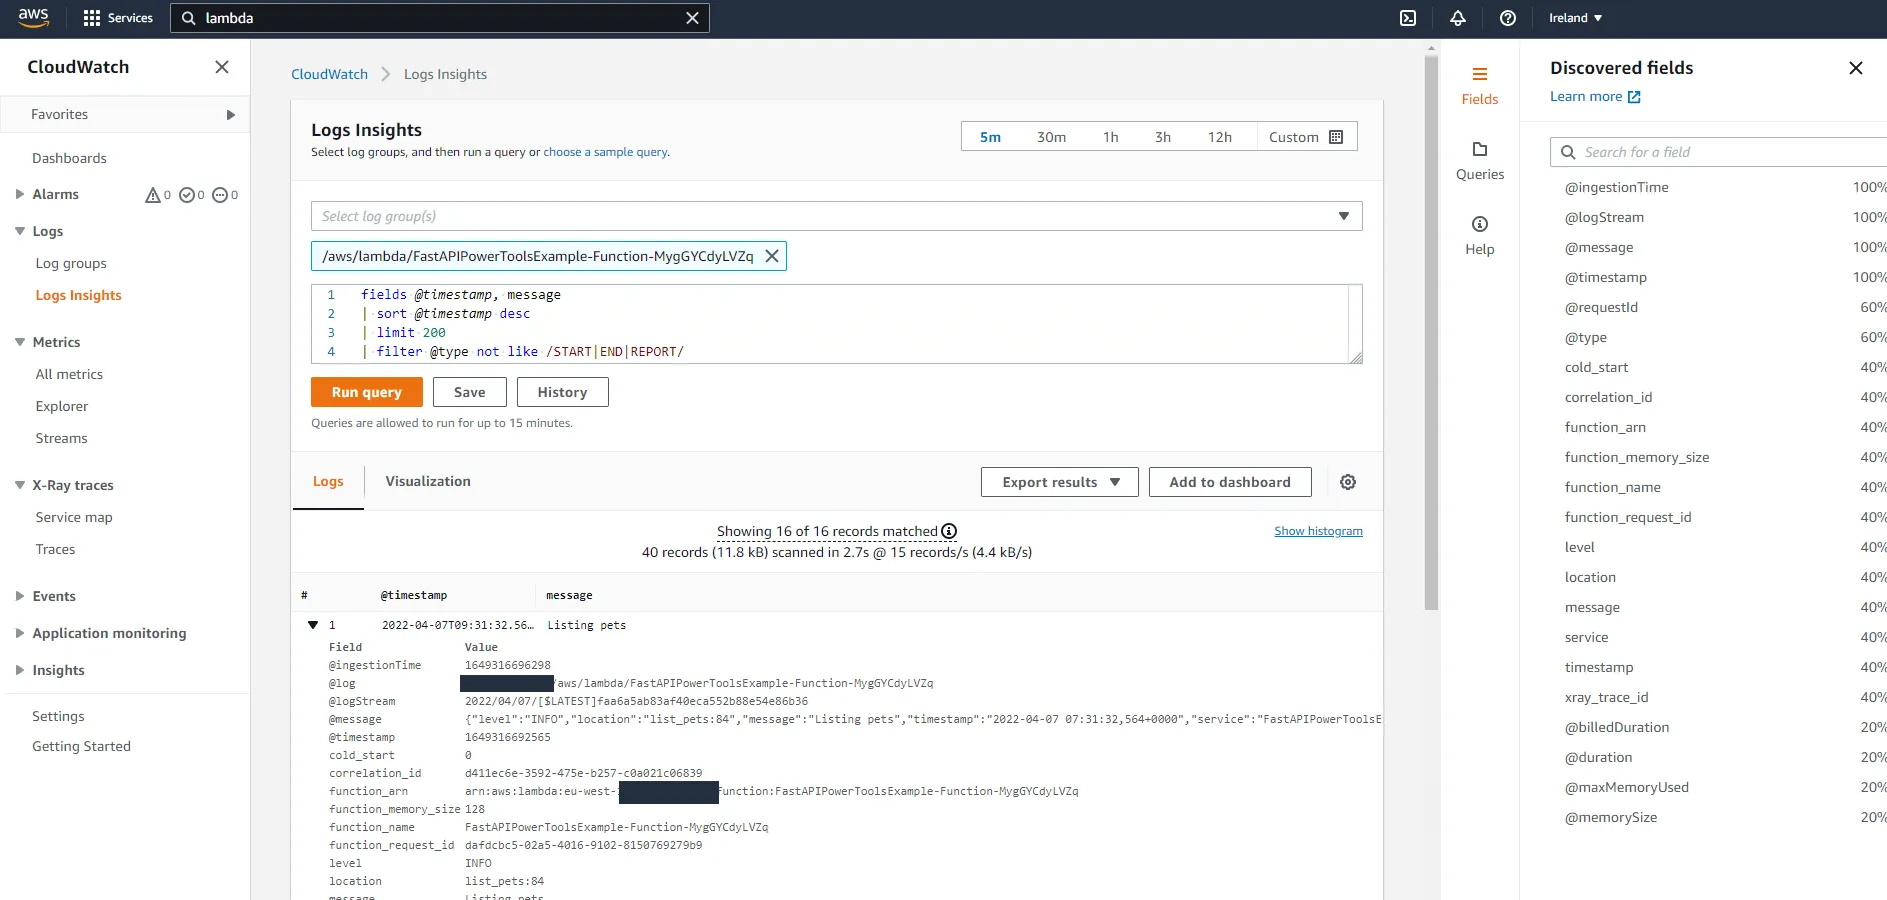
After making a few requests, navigate to the CloudWatch console and go to Logs Insights. You should see a log group called /aws/lambda/FUNCTION_NAME in the Select log group(s) dropdown.
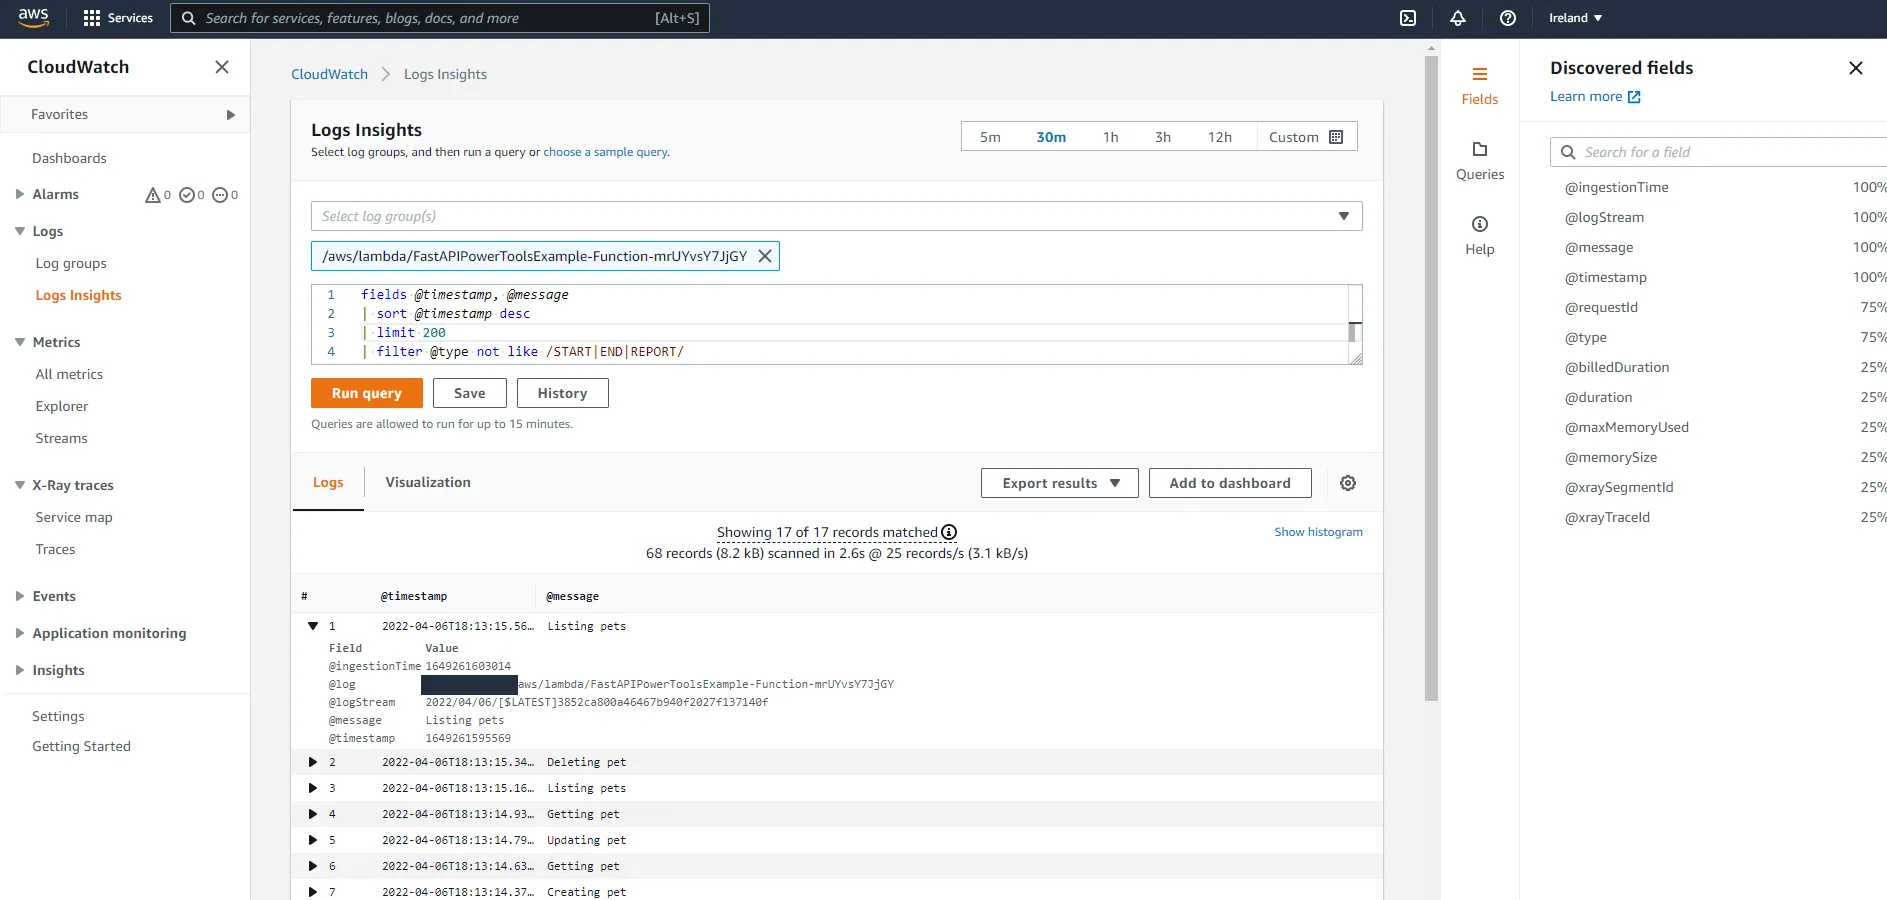
The resulting log records contain almost no useful information, which is because right now we are only using simple print(...) statements in the code. Let’s change that, shall we?
AWS Lambda Powertools Python
Lambda Powertools Python is a library that comes fully packed with utilities that make it easy to adopt best practices when it comes to the observability of AWS Lambda functions. We will focus on the three core utilities, which are: Logger, Metrics and Tracer.
First, in requirements.txt, add the library.
mangumfastapiboto3pydanticaws-lambda-powertoolsIn the application code, you will need to import and initialize the three utilities. In a new file example/src/app/utils.py, add the following:
from aws_lambda_powertools import Logger, Metrics, Tracerfrom aws_lambda_powertools.metrics import MetricUnit # noqa: F401
logger: Logger = Logger()metrics: Metrics = Metrics()tracer: Tracer = Tracer()Logging
Let’s start by adding some structured logging to the application. We will use the Logger utility from the Lambda Powertools library for this.
Upgrade from print statements
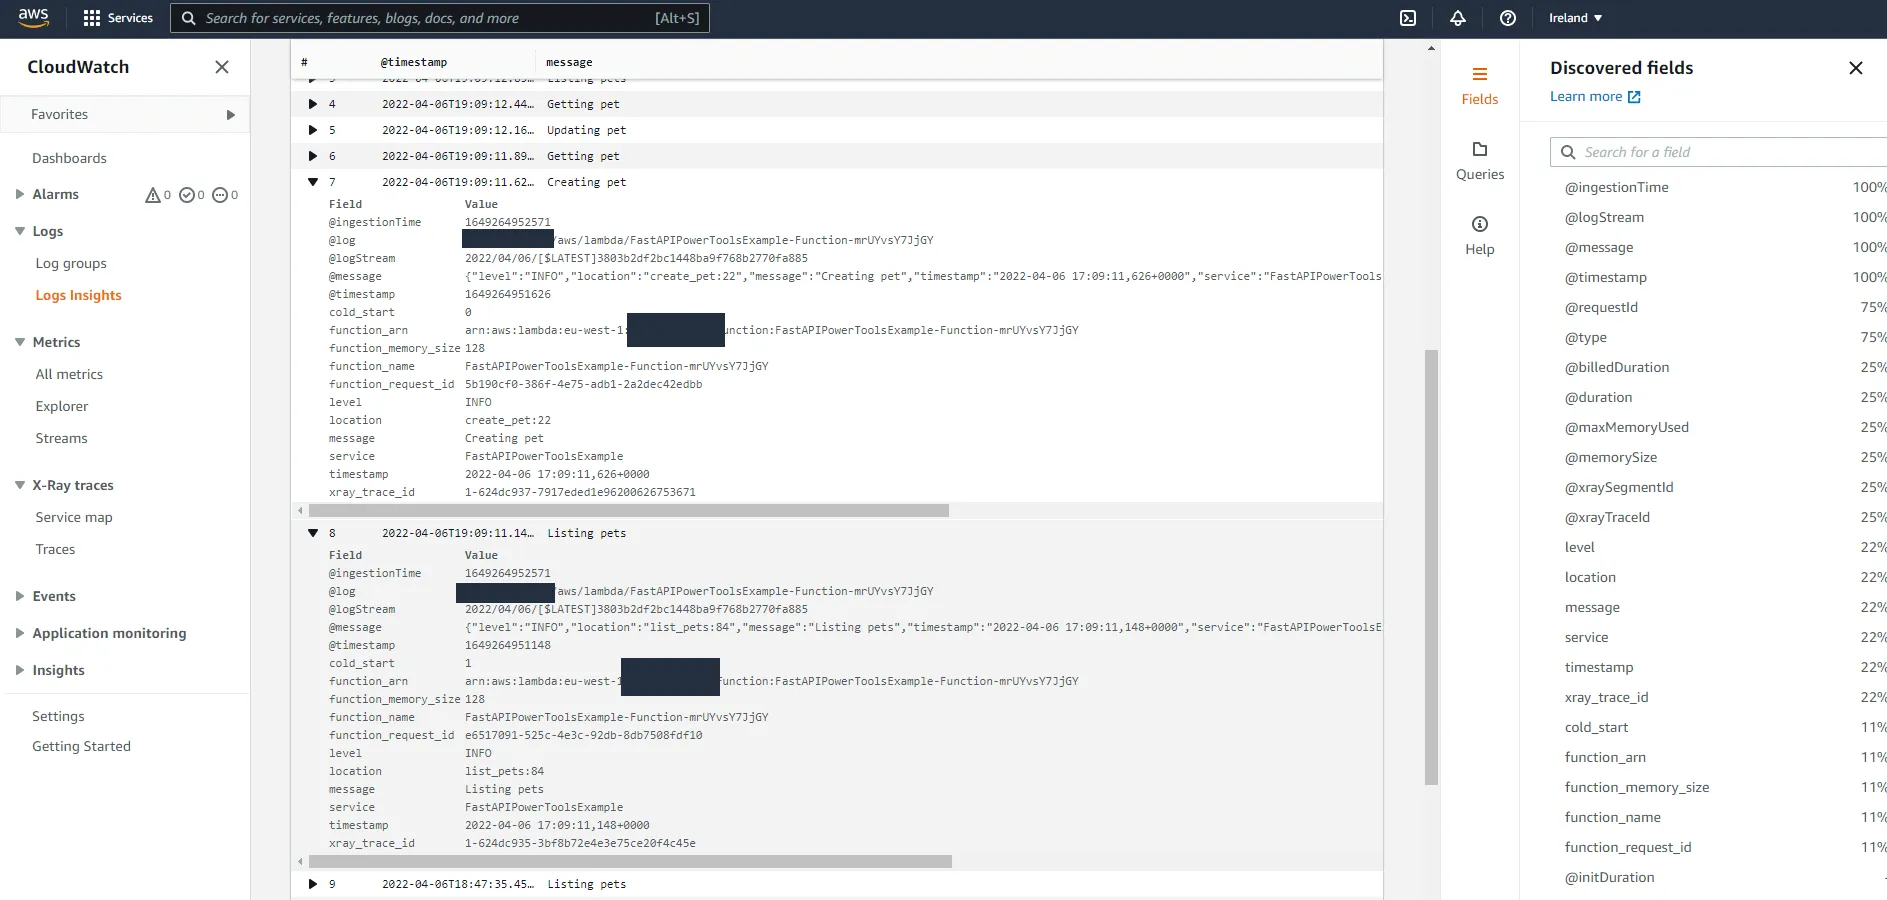
In the dynamo.py file, add from .utils import logger and change all the print(...) statements to logger.info(...). After a few requests, the experience in CloudWatch should have gotten a tad better.
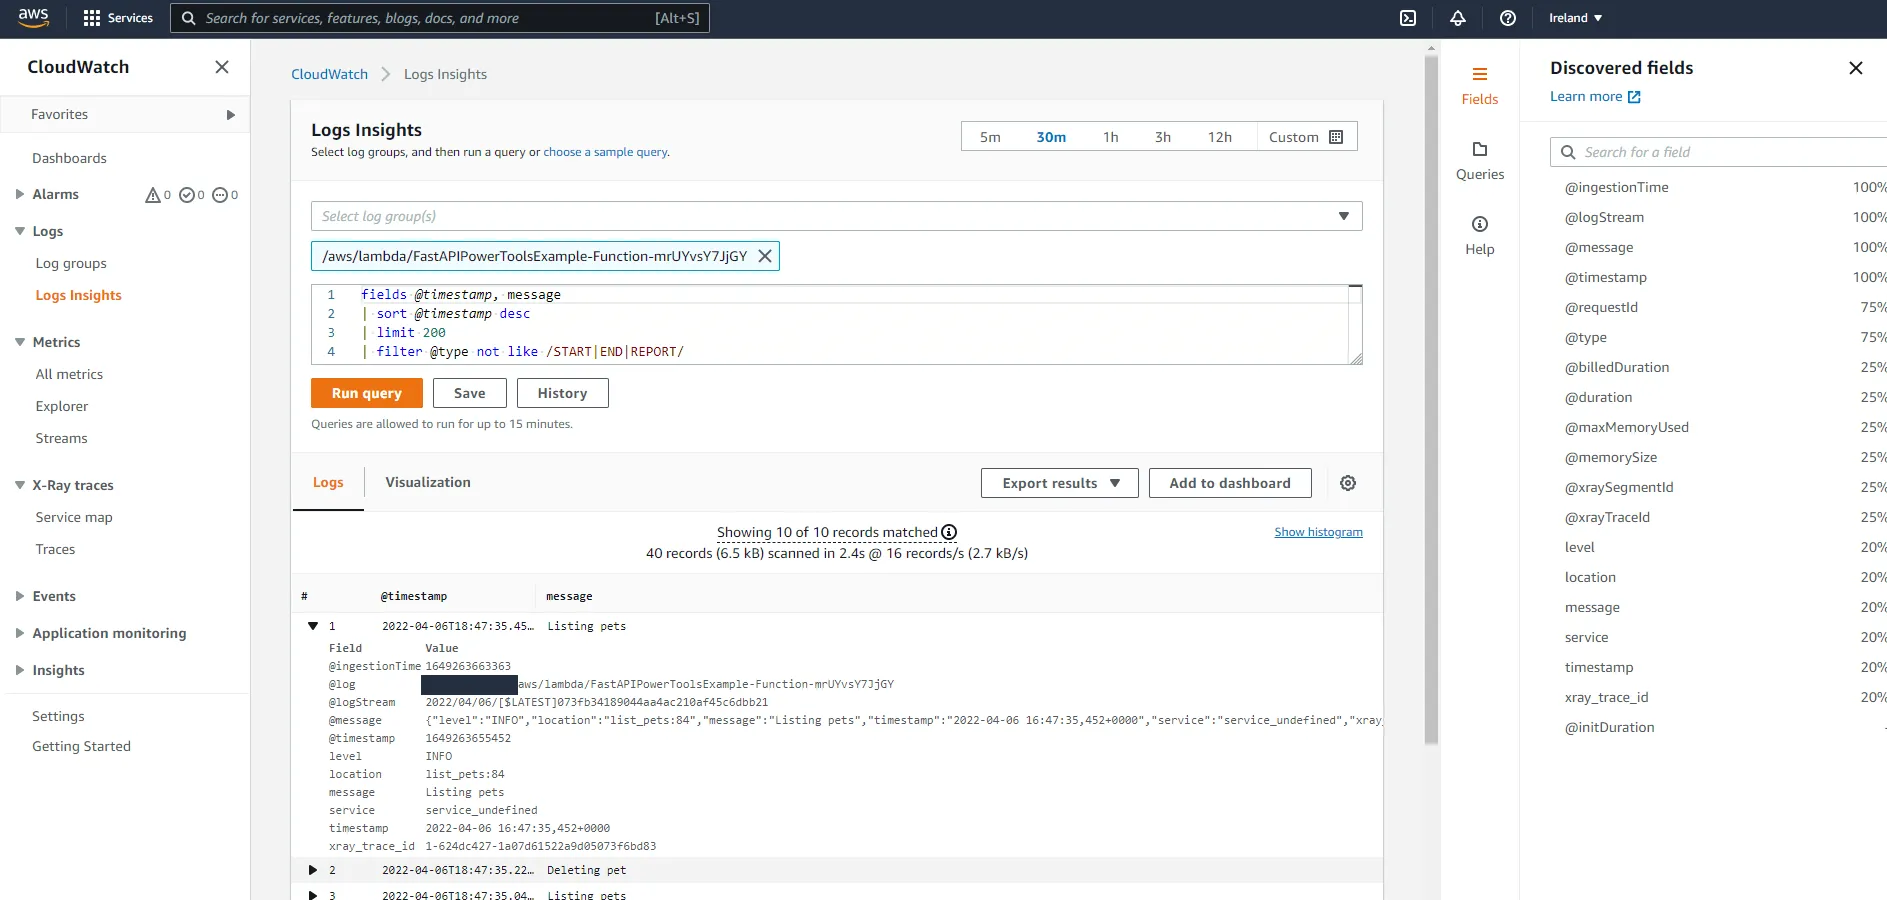
Here we can see the power of structured logging. CloudWatch has identified fields such as level, location, message, service, and so on. We can now use these fields to filter queries. If we wanted to see only error logs, we could add a filter to the query:
fields @timestamp, message| sort @timestamp desc| limit 200| filter level = "ERROR"What is that service_undefined value in the service field you ask? That’s right, we forgot one thing in the SAM template. We can control what service name Lambda Powertools uses by setting environment variables in a function. If you have a lot of different services, being able to easily filter logs by service name will be critical when you are troubleshooting a problem in production.
Function: Type: AWS::Serverless::Function Properties: ... Environment: Variables: POWERTOOLS_SERVICE_NAME: FastAPIPowerToolsExample POWERTOOLS_METRICS_NAMESPACE: FastAPINamespace TABLE_NAME: !Ref Table ...That wasn’t so hard right? Just a few lines of code, and we now have nicely structured logs in the FastAPI application. Let’s explore some more features in the Lambda Powertools Logger.
Lambda context
Powertools makes it easy to add information from the Lambda context to logs with the inject_lambda_context decorator, like this:
@logger.inject_lambda_contextdef handler(event, context): ...But we do not have a handler function, do we? We have a Mangum object wrapping the FastAPI application. Luckily, the Mangum object acts as a handler function, so we can just add the following in example/src/app/__init__.py:
...from .utils import logger
...
handler = Mangum(app)
# Add logginghandler = logger.inject_lambda_context(handler, clear_state=True)Here, we set the parameter clear_state=True to clear the state on each invocation. This is useful if you want to ensure that the logs are not polluted with the state from previous invocations.
So, one more line of code. What did that line give us in the CloudWatch console?
Some information about the Lambda context, such as function name, memory configuration, as well as whether the invocation required a cold start or not. Nice!
Correlation ID
Correlation IDs can be used to uniquely identify a request as it traverses multiple services. This is a key component to being able to correlate logs from different services in distributed systems.
In our example, the API will accept an optional X-Correlation-Id header, and if it is not present, it will use the request ID from the Lambda context. The correlation ID can then be added to requests towards downstream services (if any), to be able to get a complete view of the request flow. The Logger utility includes two helper functions to handle correlation IDs, logger.set_correlation_id("ID") and logger.get_correlation_id().
Since we want to extract the correlation ID in every request, as well as return it in every response, we will implement this using a FastAPI middleware.
In example/src/app/__init__.py, add the following:
from fastapi import FastAPI, HTTPException, Request...
@app.middleware("http")async def add_correlation_id(request: Request, call_next): # Get correlation id from X-Correlation-Id header corr_id = request.headers.get("x-correlation-id") if not corr_id: # If empty, use request id from aws context corr_id = request.scope["aws.context"].aws_request_id
# Add correlation id to logs logger.set_correlation_id(corr_id)
response = await call_next(request)
# Return correlation header in response response.headers["X-Correlation-Id"] = corr_id return responseHit the API with a few requests. If you supply a X-Correlation-Id header in the request, you should see the same X-Correlation-Id in the response. If you do not supply one, one will be generated for you. If the application makes further requests to downstream services, the correlation ID could be retrieved with logger.get_correlation_id() and passed on to the downstream service. Navigate to CloudWatch and take a look at the shiny new correlation_id field.
FastAPI context
Let’s add some information about the FastAPI request context to the logs. On the top of my head, it would be nice to be able to filter logs by the request path, request route, and the request method. Since we have the Request object in the middleware created above, couldn’t we add this functionality there? We can’t. This is because middlewares are executed before any routing is made in the FastAPI application. So if we want to add the routes as they are declared in the application, such as /pets/{pet_id}, we need to use a custom APIRoute class.
Add a new file, example/src/app/router.py, and add the following:
from fastapi import Request, Responsefrom fastapi.routing import APIRoutefrom typing import Callablefrom .utils import logger
class LoggerRouteHandler(APIRoute): def get_route_handler(self) -> Callable: original_route_handler = super().get_route_handler()
async def route_handler(request: Request) -> Response: # Add fastapi context to logs ctx = { "path": request.url.path, "route": self.path, "method": request.method, } logger.append_keys(fastapi=ctx) logger.info("Received request")
return await original_route_handler(request)
return route_handlerHere we add a few fields to the logger so that e.g. every future logger.info(...) call includes those fields. If you do not fully understand how the custom APIRoute works, please read the FastAPI documentation. He explains it a lot better than I possibly could.
Now, to use the custom APIRoute class, we need to add the following in example/src/app/__init__.py:
...from .router import LoggerRouteHandler
app = FastAPI()app.router.route_class = LoggerRouteHandler
...Let’s see what we have in CloudWatch this time.
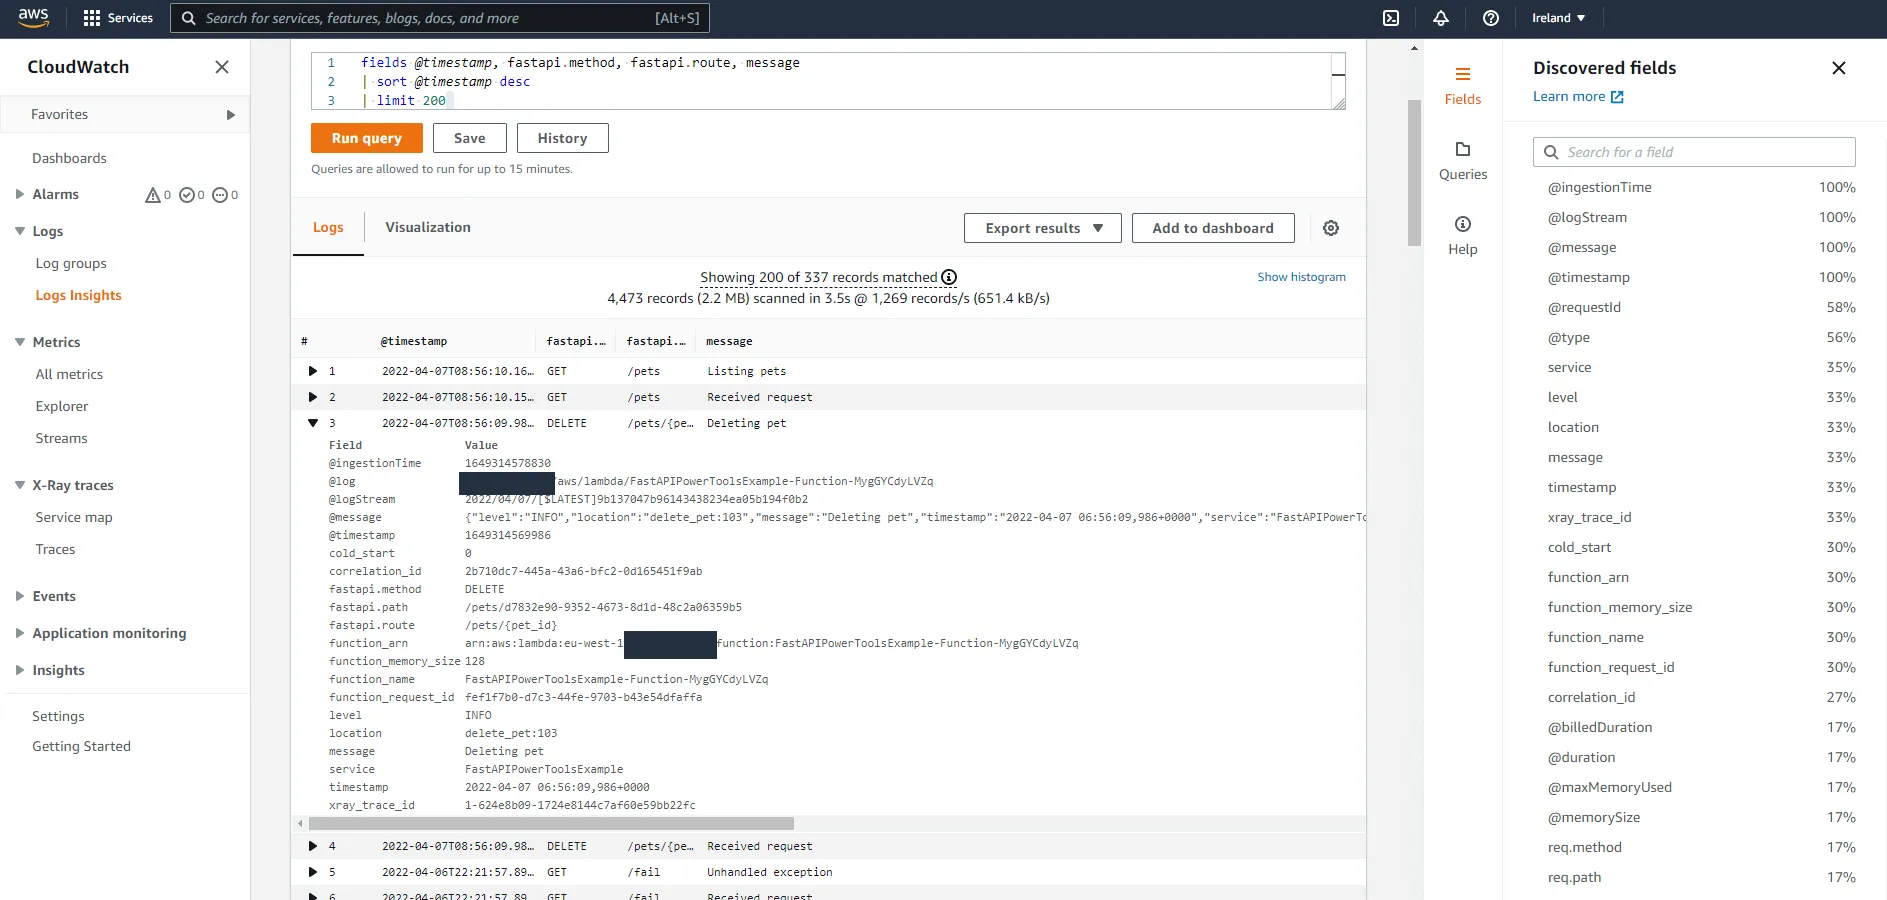
Look at that beauty. We now have filterable fields for the method, route, and actual path. Want to get all logs that occurred when someone fetched a specific pet with ID 123456? Simply add a filter to the query like | filter fastapi.method = "GET" and fastapi.path = "pets/123456". Want to see all logs from all calls to the DELETE /pets/{pet_id} route? You know what to do.
Exceptions
The Logger utility can also help us understand and debug errors easier by logging exceptions with logger.exception(...). To illustrate how Lambda Powertools can help us here, let us first add an endpoint in which we inject an error. Add the following code to example/src/app/__init__.py:
@app.get("/fail")def fail(): some_dict = {} return some_dict["missing_key"]Call the endpoint, you should receive a 500 Internal Server Error. Head over to CloudWatch and see how the exception was logged.
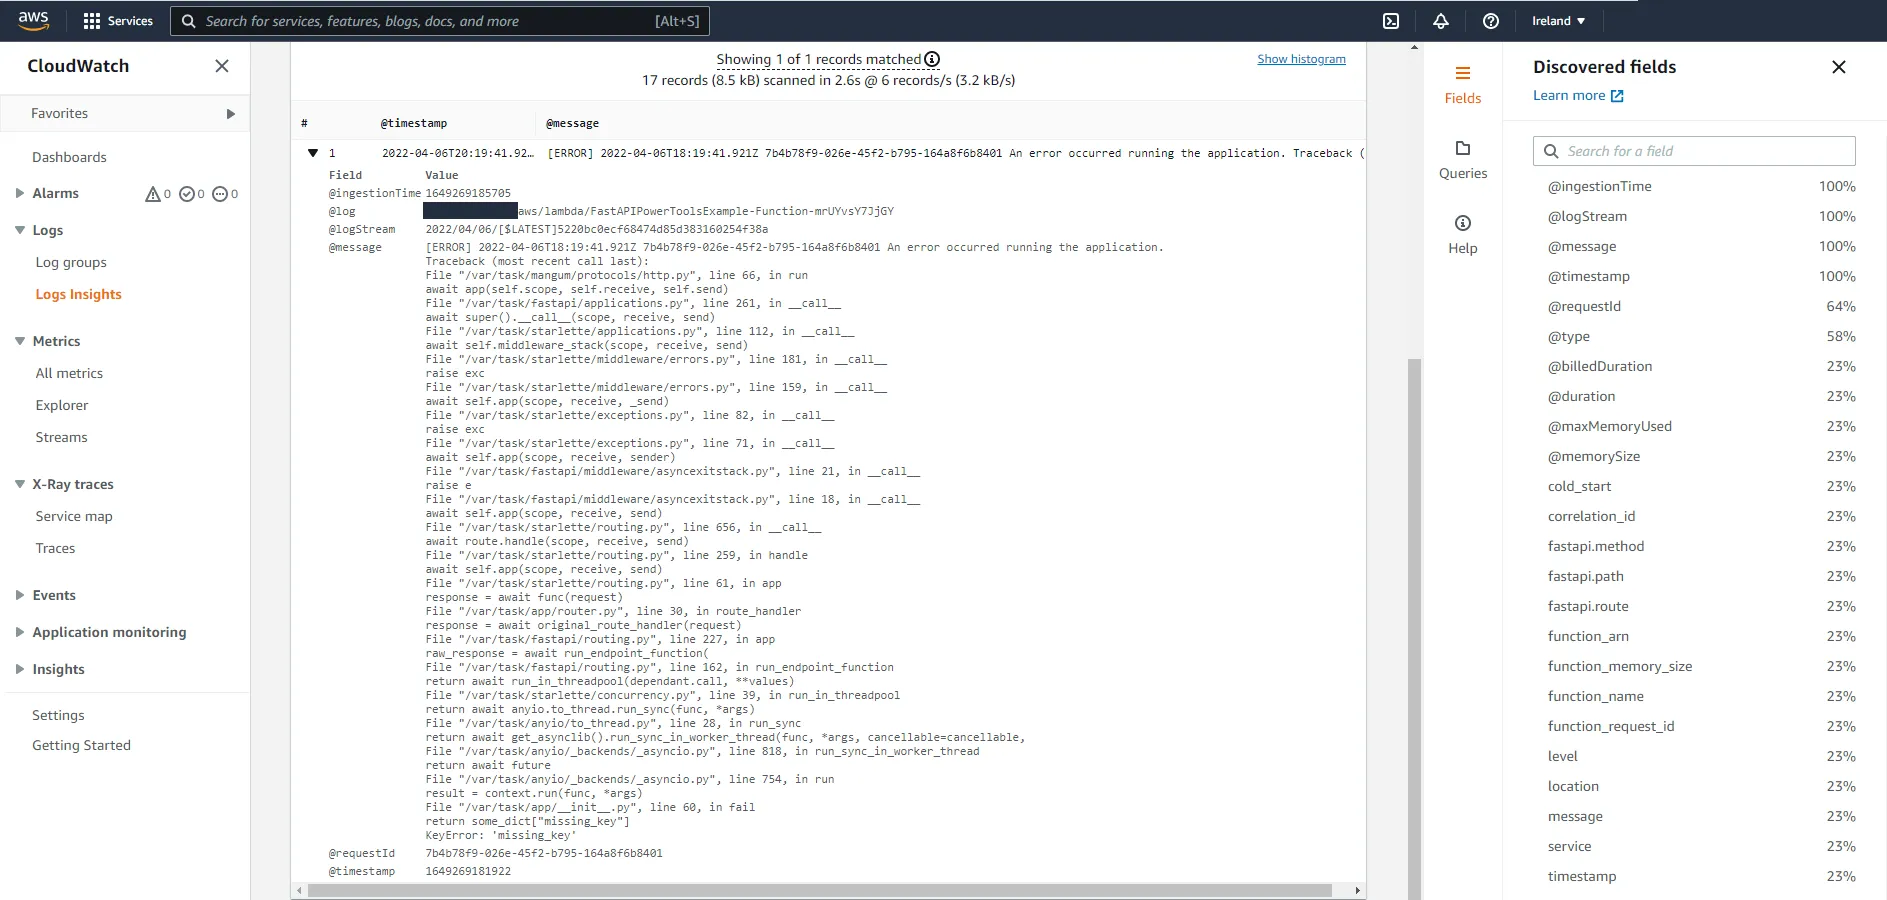
Looks like we are missing a lot of information here, such as correlation ID, route, service, and all the other fields we added previously. Let’s fix that, by adding a custom exception handler.
Warning
Creating an exception handler that catches all exceptions does not seem to be fully supported. I’ve tried just creating an exception handler for exceptions of type Exception, and it seems to enter the handler fine and the logging works. However, it does not catch the exception fully, so the exception is still propagated and finally caught in the Mangum event loop. It also does not enter the middleware that sets the correlation ID in the response.
The issue seems to be resolved by adding a starlette.exceptions.ExceptionMiddleware, though I’m unsure if this can have any unforeseen side effects. Use at your own risk! :)
Further information on FastAPI GitHub Issue and Starlette GitHub Issue:
In example/src/app/__init__.py, add the following:
from fastapi import FastAPI, HTTPExceptionfrom fastapi.responses import JSONResponsefrom starlette.exceptions import ExceptionMiddleware
...
app = FastAPI()app.router.route_class = LoggerRouteHandlerapp.add_middleware(ExceptionMiddleware, handlers=app.exception_handlers)
@app.exception_handler(Exception)async def unhandled_exception_handler(request, err): logger.exception("Unhandled exception") return JSONResponse(status_code=500, content={"detail": "Internal Server Error"})Call the /fail endpoint again and head over to CloudWatch.
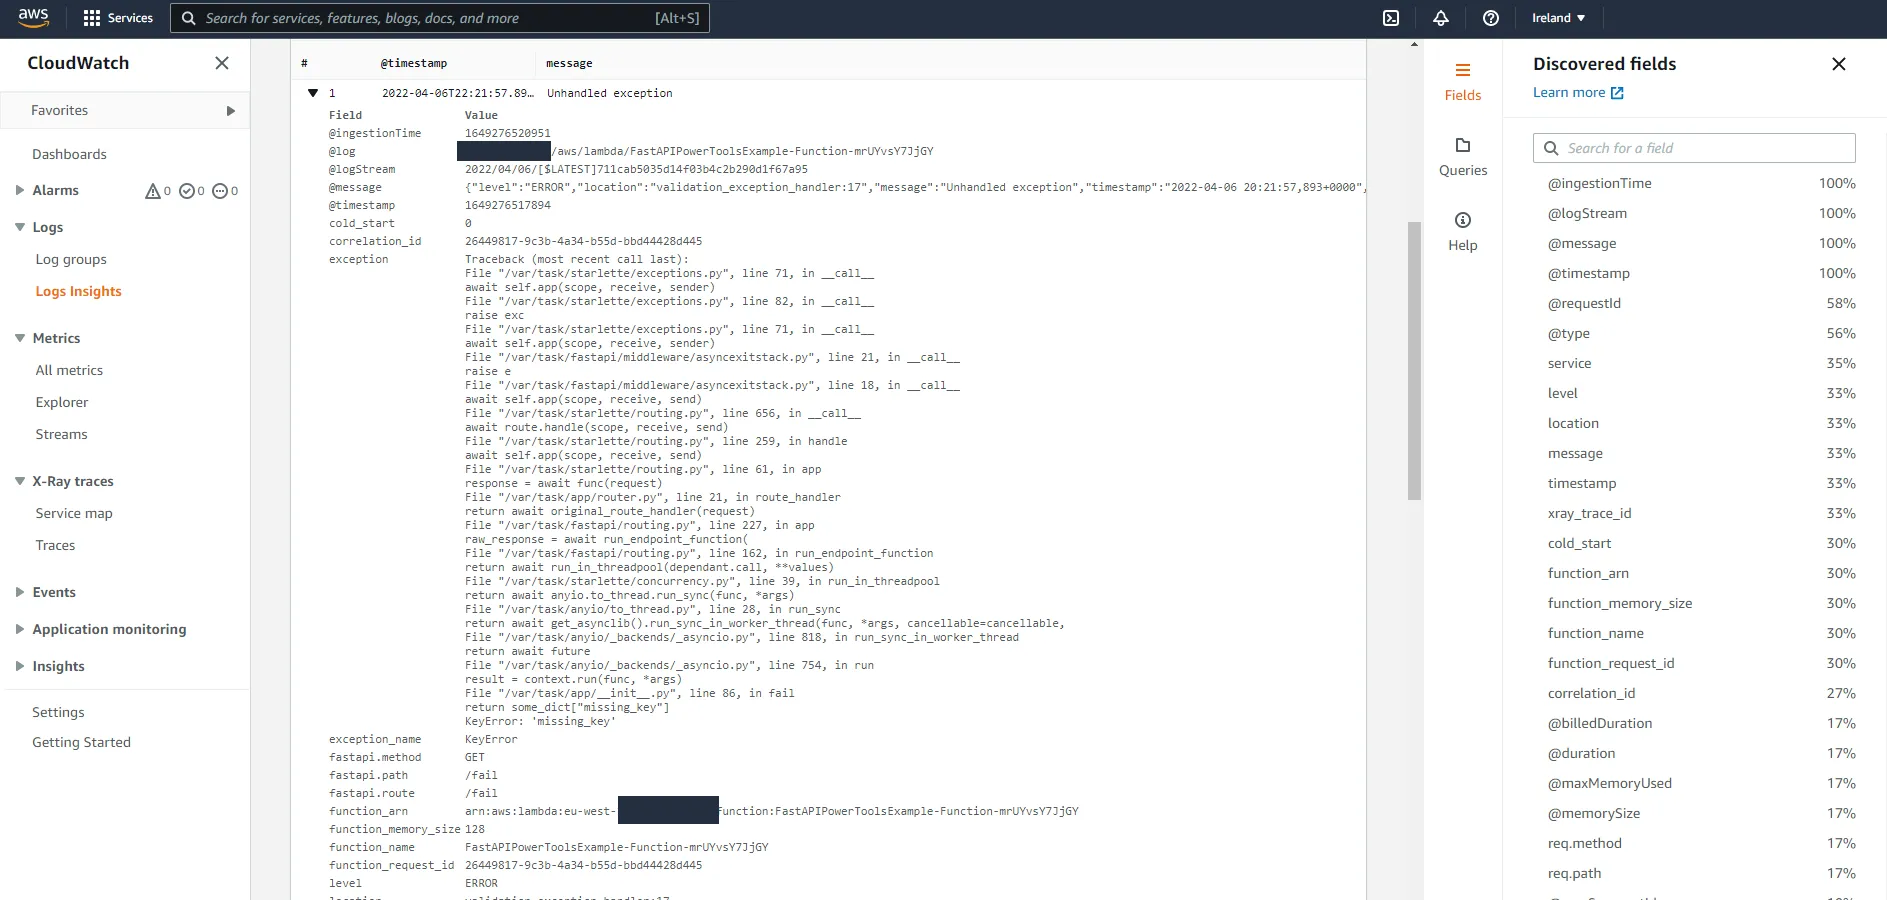
Now we have a lot of relevant information in logs whenever an unhandled exception occurs, which makes it easy to find what caused a request to fail if you for example have the correlation ID at hand.
The logs are now a lot more useful, and we did not need to add that much code to the application. Most of the code resides in either middleware, exception handlers, or the custom APIRoute class. The changes to the actual business logic have been minimal, which shows that Lambda Powertools can easily be added to existing applications to improve logging practices.
Metrics
Let’s explore the next core utility in Lambda Powertools, the Metrics utility. This utility lets you easily push metrics to CloudWatch by taking care of all the necessary boilerplate. It works asynchronously by using Amazon CloudWatch Embedded Metrics Format, by logging the metrics to stdout. It also aggregates all metrics from each invocation to save on the number of calls to CloudWatch.
Info
There is some terminology to be aware of here. CloudWatch metrics are grouped in containers called namespaces. If an application comprises multiple services, you could for example use the same namespace for all of them to group all the metrics for that application. Metrics can also have dimensions, which are key-value pairs added as metadata to metrics which allows you to filter and aggregate metrics depending on the dimension values.
The default configuration for the Metrics utility utilizes the two environment variables POWERTOOLS_METRICS_NAMESPACE and POWERTOOLS_SERVICE_NAME, where the former specifies the metric namespace and the latter adds a dimension service=POWERTOOLS_SERVICE_NAME to all metrics.
Instrumenting
If you followed along with the guide so far you should already have a metrics object in example/src/app/utils.py. There we used the default configuration, which sets the namespace and service dimension from environment variables. You could also specify those explicitly, like this:
from aws_lambda_powertools import Metrics
metrics = Metrics() # Sets metric namespace and service dimension via environment variablesmetrics = Metrics(namespace="Namespace", service="ServiceA") # Sets metric namespace to "Namespace" and service dimension to "ServiceA"If you want to add another dimension to all metrics, such as environment, you can do so with the set_default_dimensions method:
from aws_lambda_powertools import Metrics
metrics = Metrics()metrics.set_default_dimensions(environment="development")Now, to enable the functionality in the application, add the following to example/src/app/__init__.py:
...from .utils import tracer, logger, metrics, MetricUnit
...
# Add logginghandler = logger.inject_lambda_context(handler, clear_state=True)# Add metrics last to properly flush metrics.handler = metrics.log_metrics(handler, capture_cold_start_metric=True)Note
Make sure that the log_metrics decorator is added last to the handler
function.
Adding metrics
Let’s add the following metrics to the application:
- Number of times a pet is created
- Number of times an unhandled exception occurs
Created pets metric
To add a metric that counts how many times a pet is created, we can add the following to the POST /pets route. We add it after the call to DynamoDB, to only record a metric if the pet was created successfully.
@app.post("/pets", status_code=201, response_model=models.PetResponse)def post_pet(payload: models.CreatePayload): res = dynamo.create_pet(kind=payload.kind, name=payload.name) metrics.add_metric(name="CreatedPets", unit=MetricUnit.Count, value=1) return resUnhandled exception metric
To count the number of unhandled exceptions, we can add the following to the exception handler:
@app.exception_handler(Exception)async def validation_exception_handler(request, err): metrics.add_metric(name="UnhandledExceptions", unit=MetricUnit.Count, value=1) logger.exception("Unhandled exception") return JSONResponse(status_code=500, content={"detail": "Internal Server Error"})Using different dimensions
When using CloudWatch EMF, all metrics in a document must have the same dimensions. So, all calls to add_metric will generate metrics with identical dimensions, service plus any additional default dimensions you’ve added. To add different dimensions for specific metrics, we need to use single_metric. We might for example want to have a metric named RequestCount, that has both service and route dimensions.
First, in example/src/app/utils.py, update the following import to include single_metric:
from aws_lambda_powertools import Logger, Metrics, Tracerfrom aws_lambda_powertools.metrics import MetricUnit, single_metric # noqa: F401Then, in example/src/app/router.py, add the following code:
from fastapi import Request, Responsefrom fastapi.routing import APIRoutefrom typing import Callablefrom .utils import logger, metrics, MetricUnit, single_metric
class LoggerRouteHandler(APIRoute): def get_route_handler(self) -> Callable: original_route_handler = super().get_route_handler()
async def route_handler(request: Request) -> Response: # Add fastapi context to logs ctx = { "path": request.url.path, "route": self.path, "method": request.method, } logger.append_keys(fastapi=ctx) logger.info("Received request")
# Add count metric with method + route as dimenision with single_metric(name="RequestCount", unit=MetricUnit.Count, value=1) as metric: metric.add_dimension(name="route", value=f"{request.method} {self.path}")
return await original_route_handler(request)
return route_handlerCloudWatch showtime
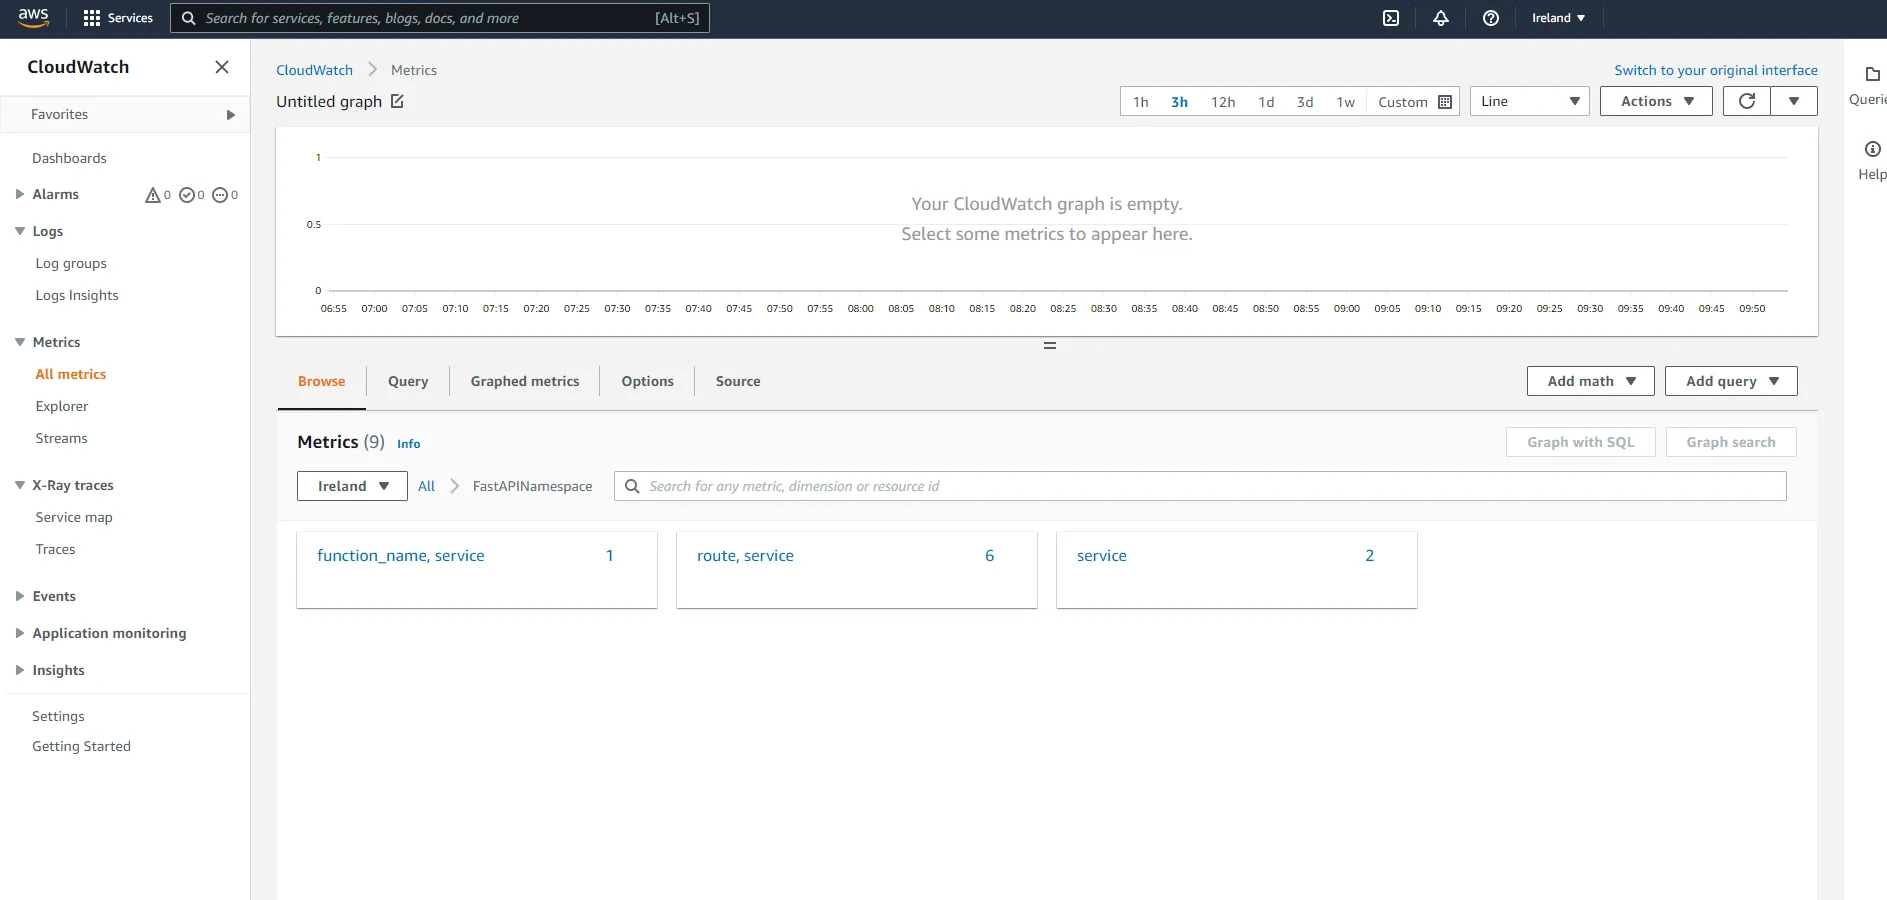
Let’s hit the API a few times on different routes, as well as the /fail endpoint. Then, navigate to CloudWatch and click on All metrics on the left-hand side. Then, click on the Namespace you specified. You should see the following.
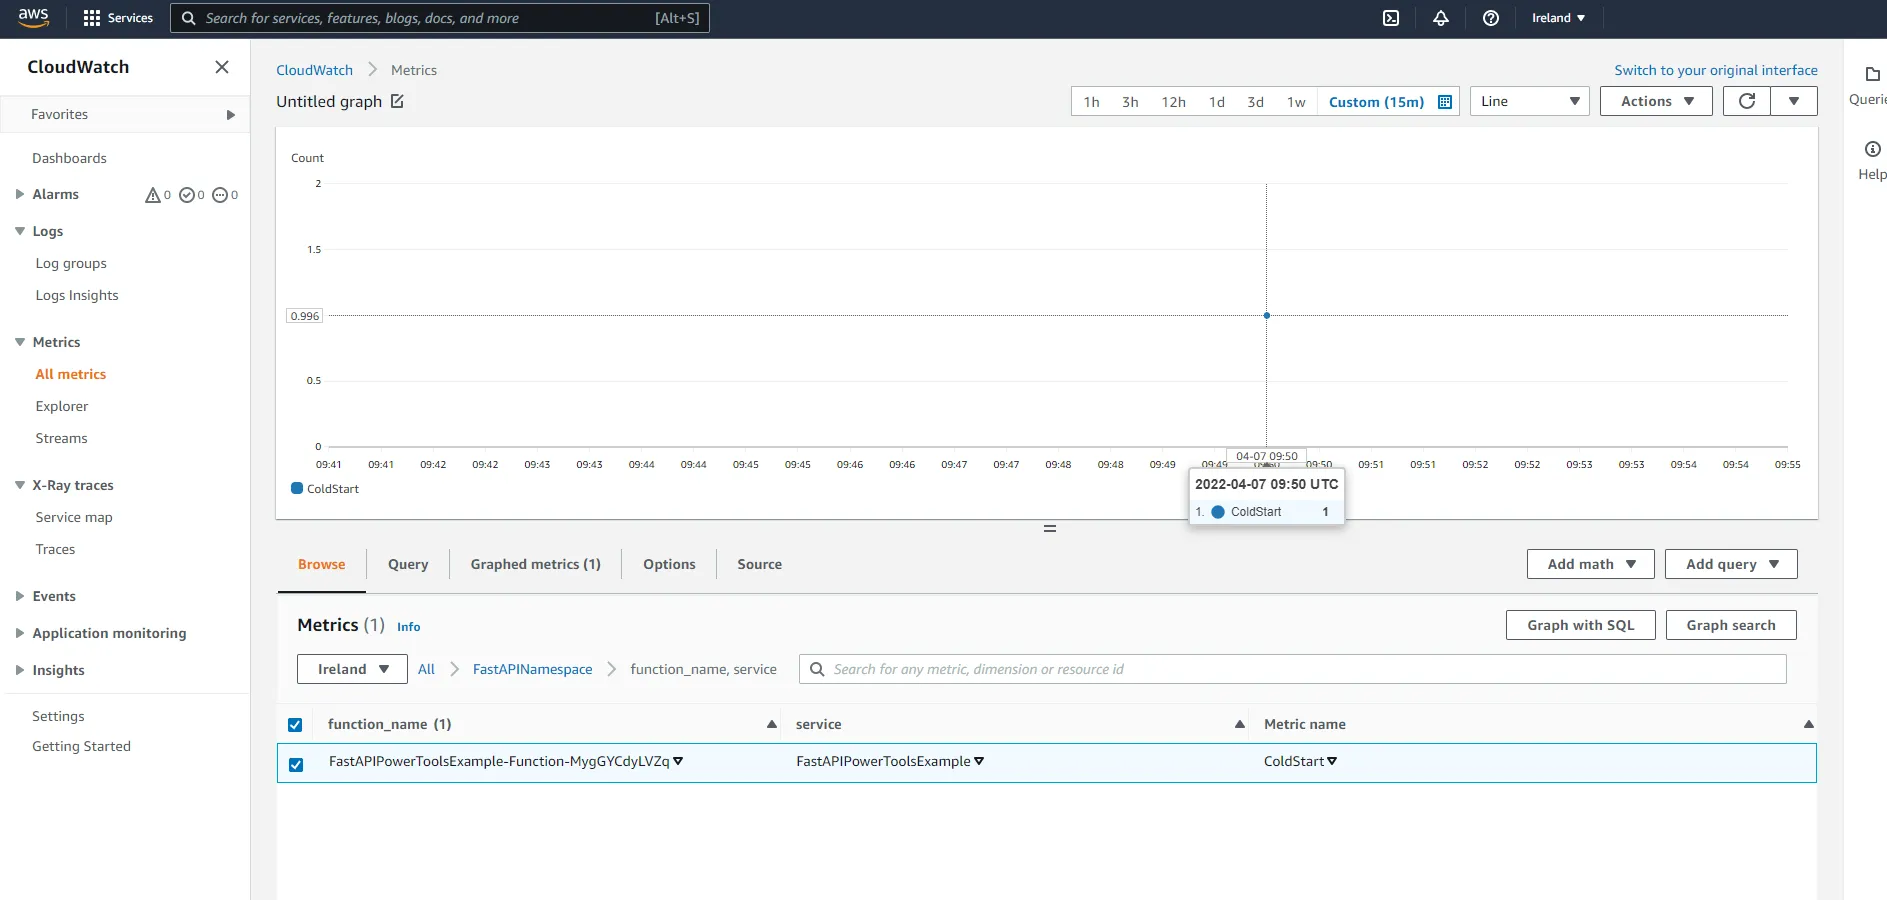
First, click on function_name, service. Here you should see a metric that counts the number of times a function has been subject to a cold start which is automatically added by the Lambda Powertools metrics utility when you add the capture_cold_start_metric=True parameter.
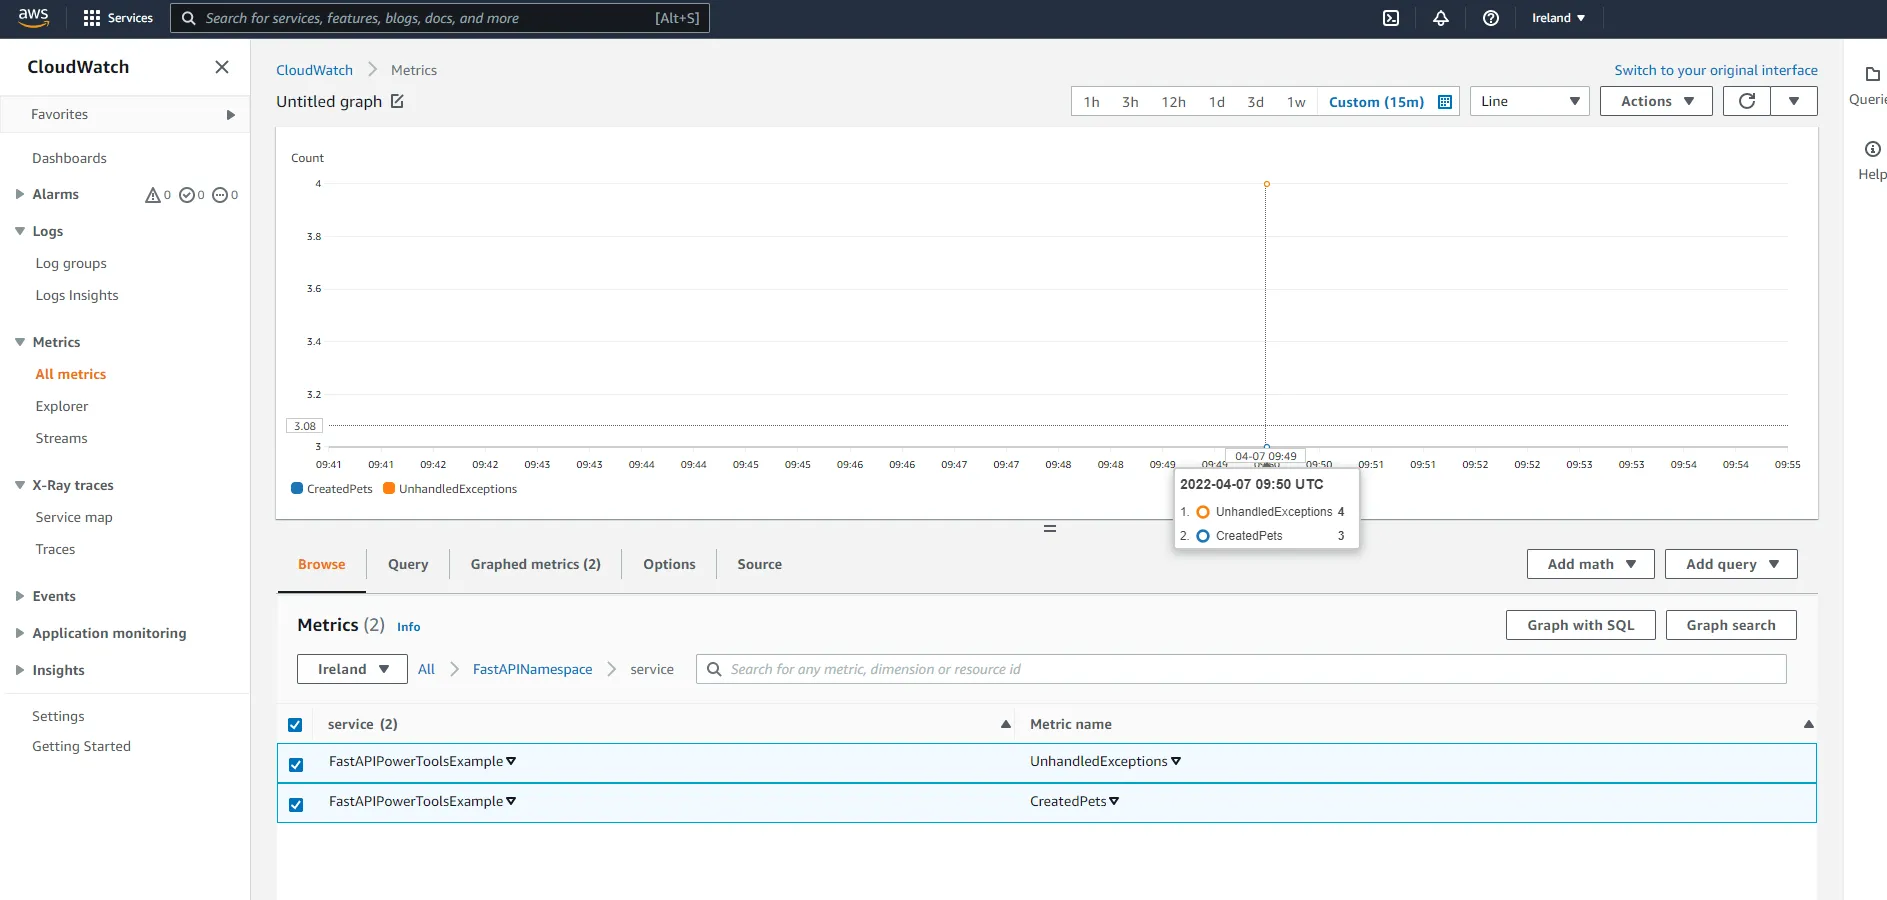
Next, click on service under the namespace. Here you will be able to see the number of pets that have been created, as well as the number of unhandled exceptions.
Finally, check out route, service. Here you should have metrics describing the total amount of requests to each route.
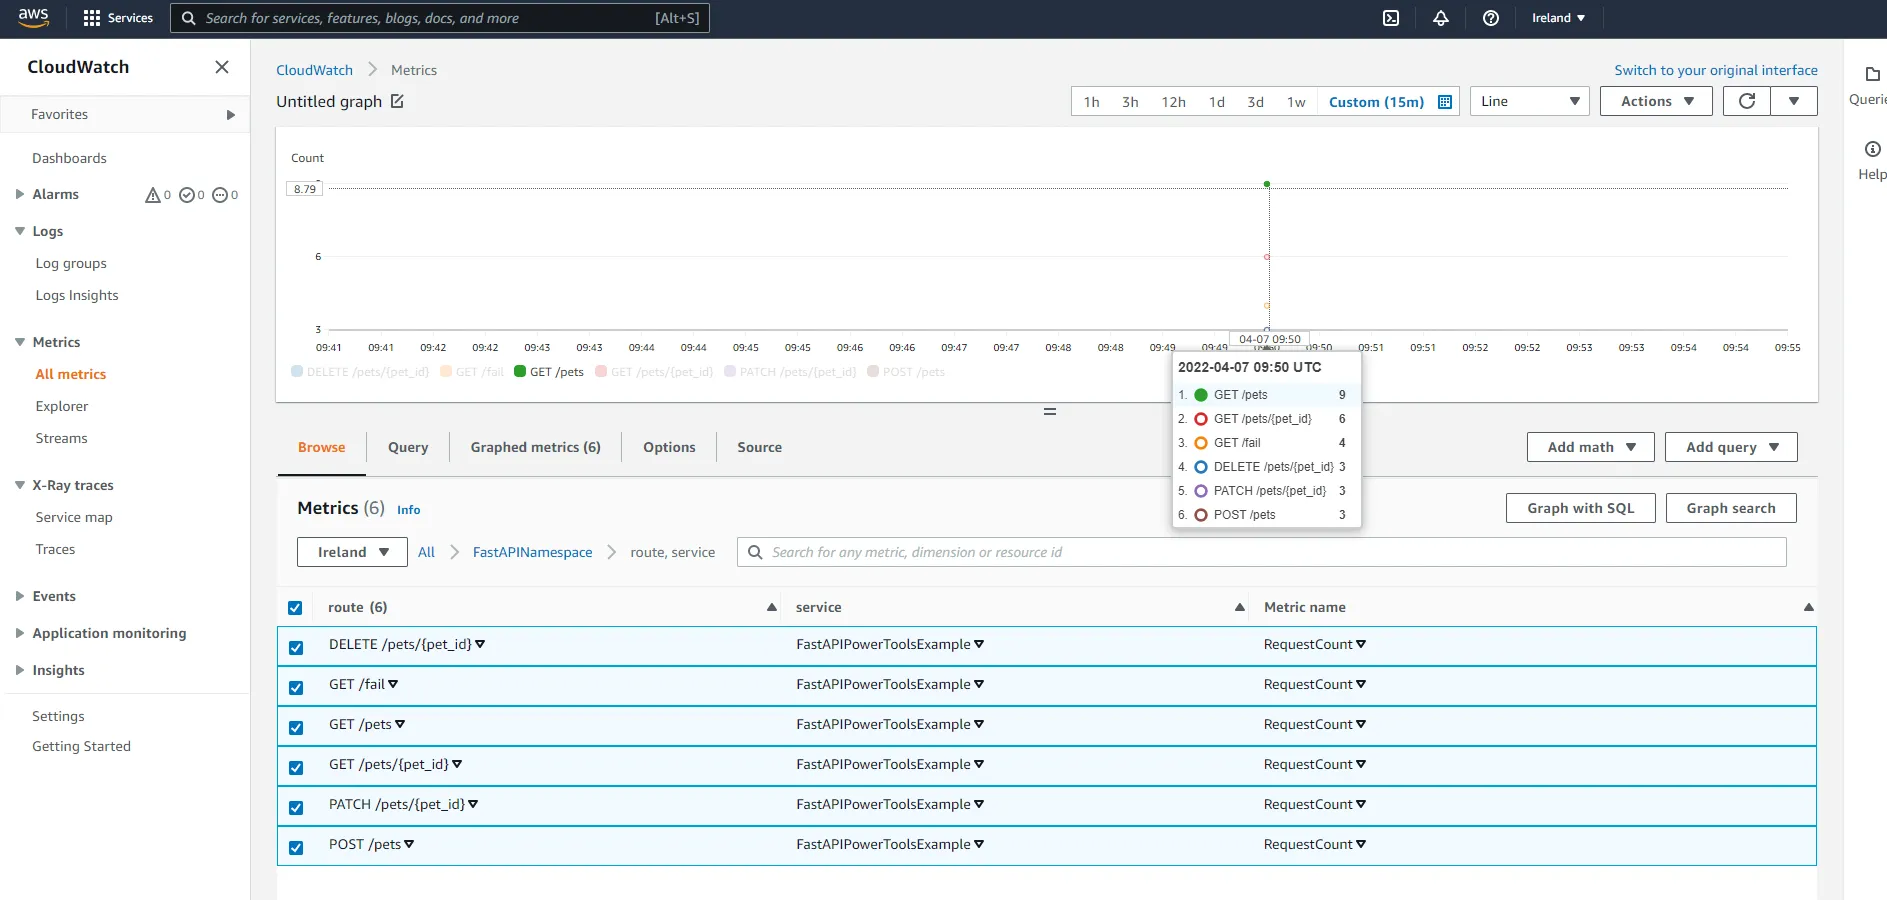
This showcases how easy it is to add metrics to a FastAPI Lambda application when using Lambda Powertools to take care of the heavy lifting.
Tracing
Now, let’s move on to the final core utility, the Tracer. The utility makes it easy to instrument your Lambda function to capture traces and send them to AWS X-Ray. AWS X-Ray is a distributed tracing system that can help you analyze and debug distributed applications, and provides a way to track requests as they travel through your different services.
Powertools also has the convenience of auto-patching modules supported by X-Ray, such as boto3. This will automatically create segments in your traces whenever you use boto3 to call DynamoDB or another AWS service from within your Lambda function, and likewise for other supported modules such as requests.
Instrumenting
First, we need to enable tracing on the Lambda function and API Gateway. In the SAM template, add the following:
Function: Type: AWS::Serverless::Function Properties: Tracing: Active MemorySize: 128---RestApi: Type: AWS::Serverless::Api Properties: StageName: Prod TracingEnabled: trueThen, as with the other utilities, we need to decorate our handler. Add the following to example/src/app/__init__.py:
...from .utils import tracer, logger, metrics, MetricUnit
...
handler = Mangum(app)
# Add tracinghandler.__name__ = "handler" # tracer requires __name__ to be sethandler = tracer.capture_lambda_handler(handler)# Add logginghandler = logger.inject_lambda_context(handler, clear_state=True)# Add metrics last to properly flush metrics.handler = metrics.log_metrics(handler, capture_cold_start_metric=True)If you want to measure a specific method call and add it to your traces, you can decorate functions with the capture_method decorator. For illustrative purposes, add the following to example/src/app/dynamo.py:
...from .utils import tracer
...
@tracer.capture_methoddef create_pet(kind: str, name: str) -> dict:...
@tracer.capture_methoddef get_pet(pet_id: str) -> dict:...
@tracer.capture_methoddef update_pet(pet_id: str, kind: str = None, name: str = None):...
@tracer.capture_methoddef list_pets(next_token: str = None) -> dict:...
@tracer.capture_methoddef delete_pet(pet_id: str):...Deploy the API, and send a couple of request to it. Mix it up a little and hit the /fail endpoint a few times, as well as try to generate some 4xx responses by trying to access non-existent pets, or create pets with invalid payloads. Go to the CloudWatch console and click on Service Map on the left-hand side.
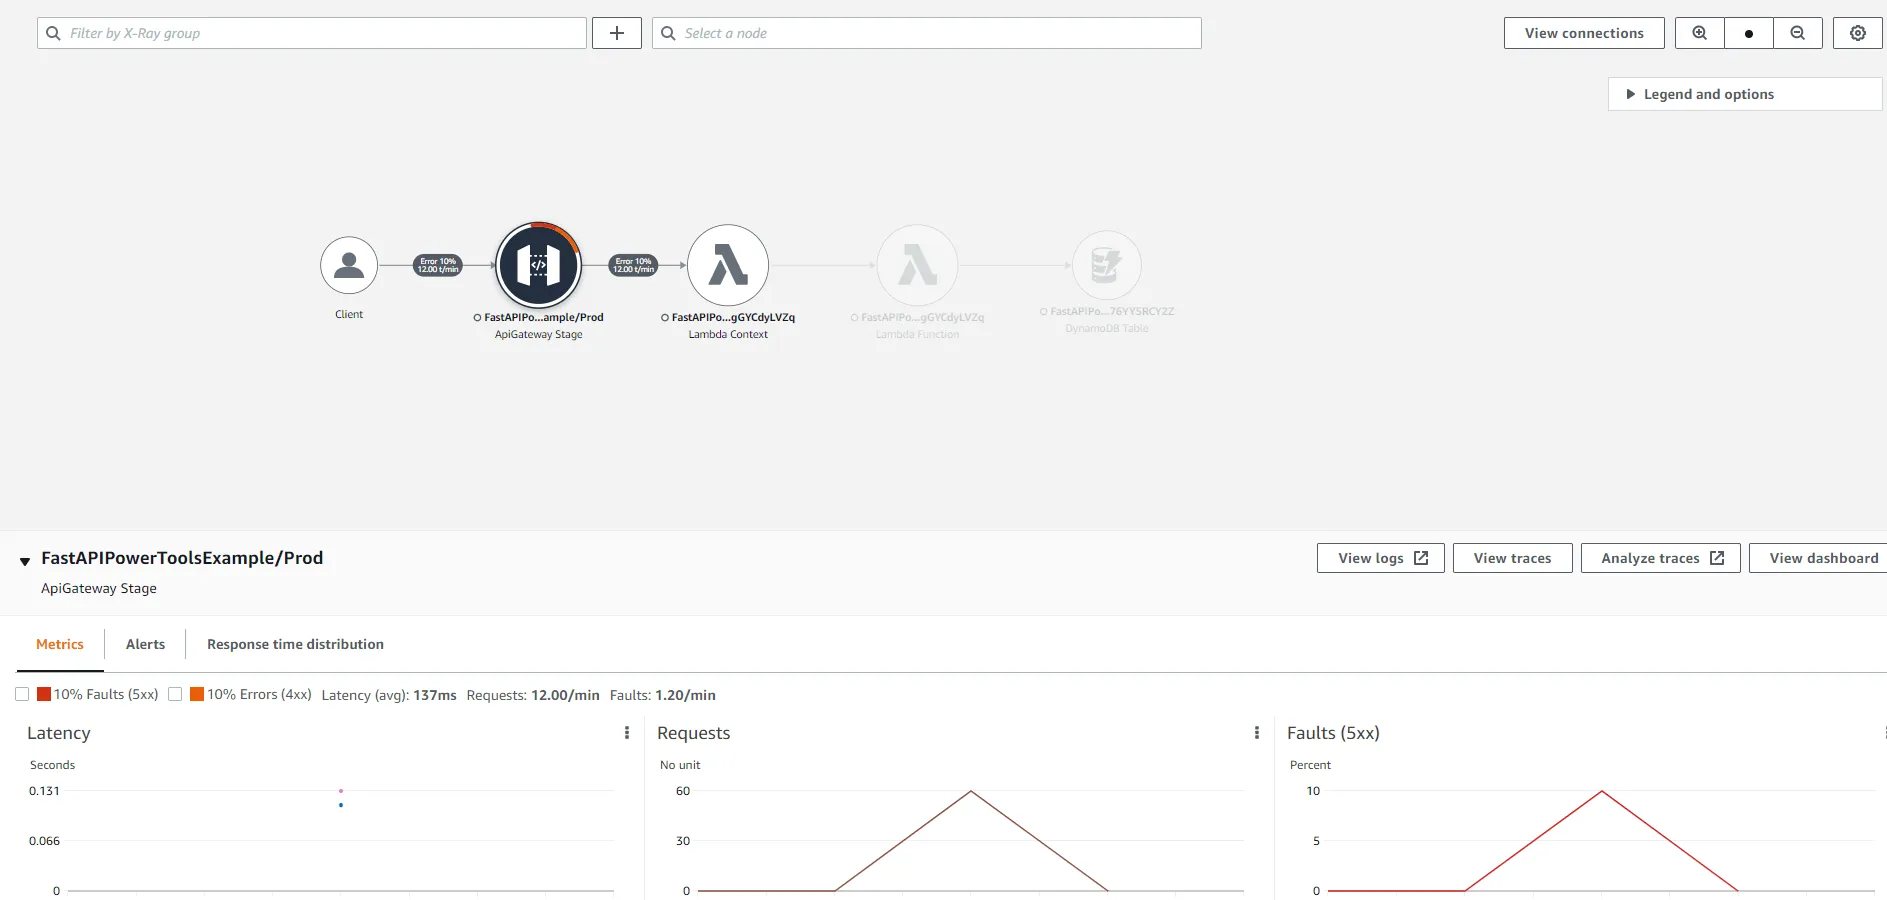
Here you can see that AWS X-Ray generated a service map of our entire architecture. We can see that a client has made a request to the API Gateway, which forwarded the request to the Lambda service, which in turn invoked a Lambda function, which then made further requests to the DynamoDB Table. As the system grows, the service map will be an invaluable tool to get a full picture of the entire system. For each node in the map, it is also possible to see the percentage of successful requests, average latency, and other useful metrics.
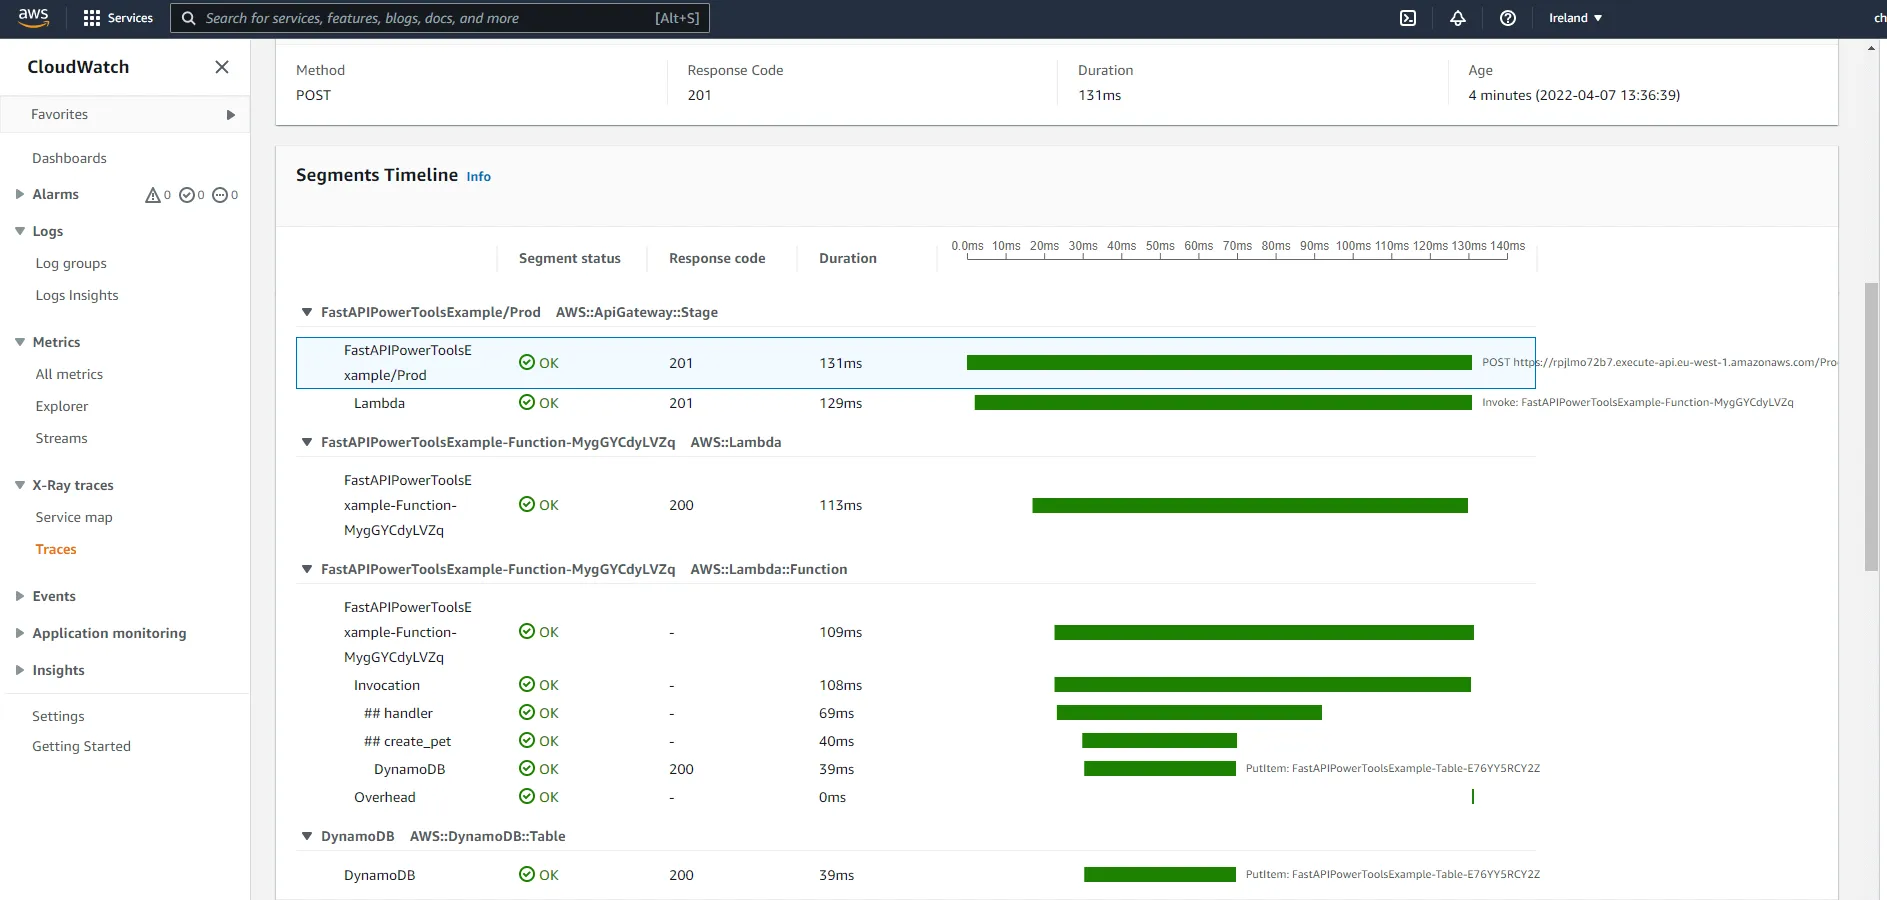
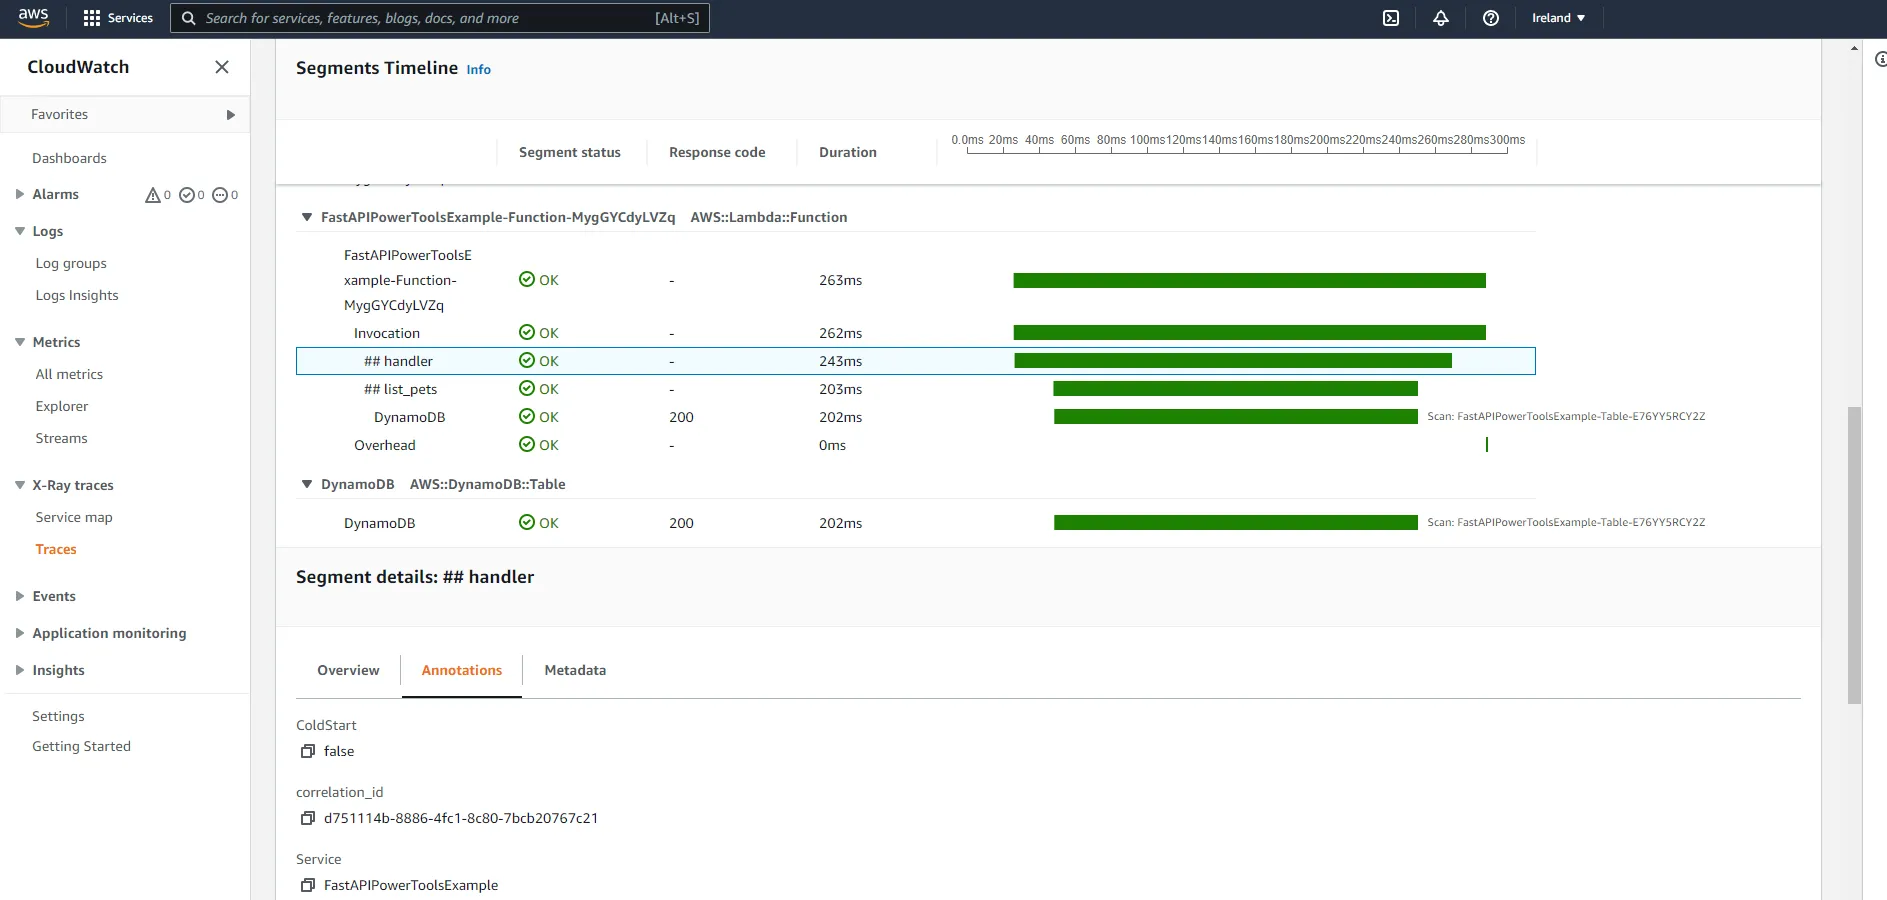
You can also drill down into individual traces. Below you can see timeline for a request to create a pet.
Advanced features
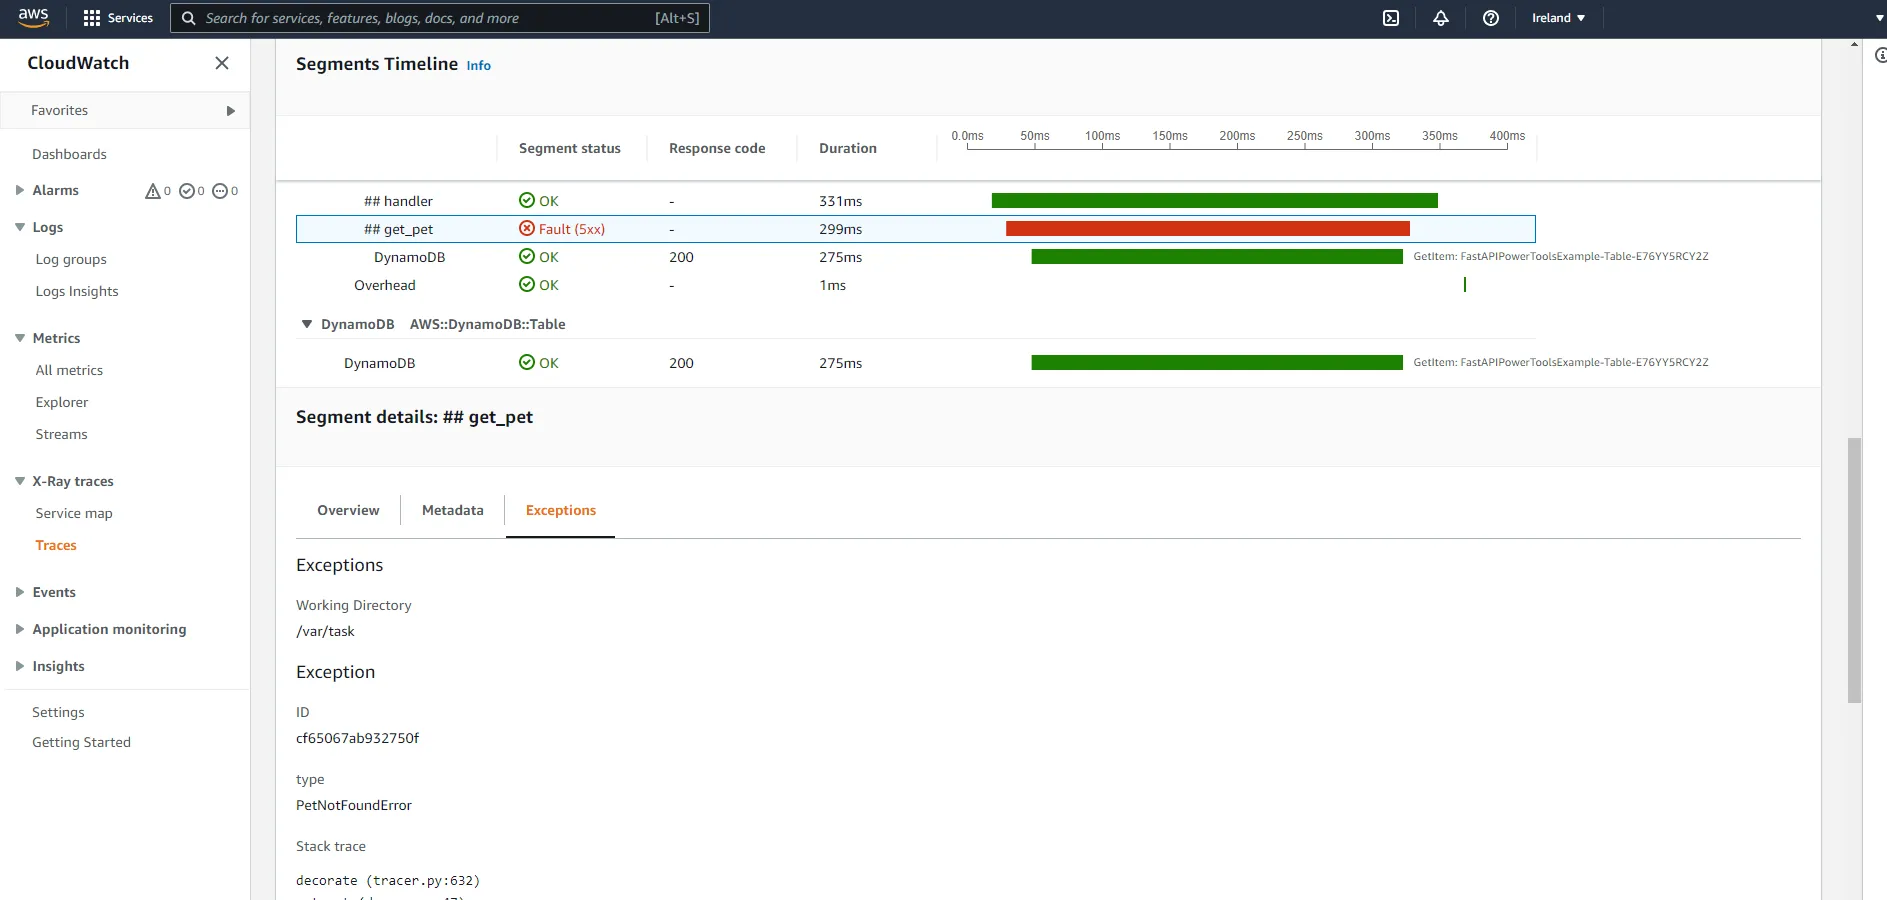
There are a lot of advanced features in the tracer utility, such as adding metadata and annotations, recording responses, and capturing exceptions.
For example, when we raise PetNotFoundError, it will be visible in the relevant segment details.
We could also add the correlation ID as an annotation, to allow us to filter and query traces by correlation ID. In the add_correlation_id middleware, add the following:
@app.middleware("http")async def add_correlation_id(request: Request, call_next): # Get correlation id from X-Correlation-Id header corr_id = request.headers.get("x-correlation-id") if not corr_id: # If empty, use request id from aws context corr_id = request.scope["aws.context"].aws_request_id
# Add correlation id to logs logger.set_correlation_id(corr_id)
# Add correlation id to traces tracer.put_annotation(key="correlation_id", value=corr_id)
response = await call_next(request)
# Return correlation header in response response.headers["X-Correlation-Id"] = corr_id return responseNow, by drilling down into the ##handler segment, you should see the correlation ID in the correlation_id annotation.
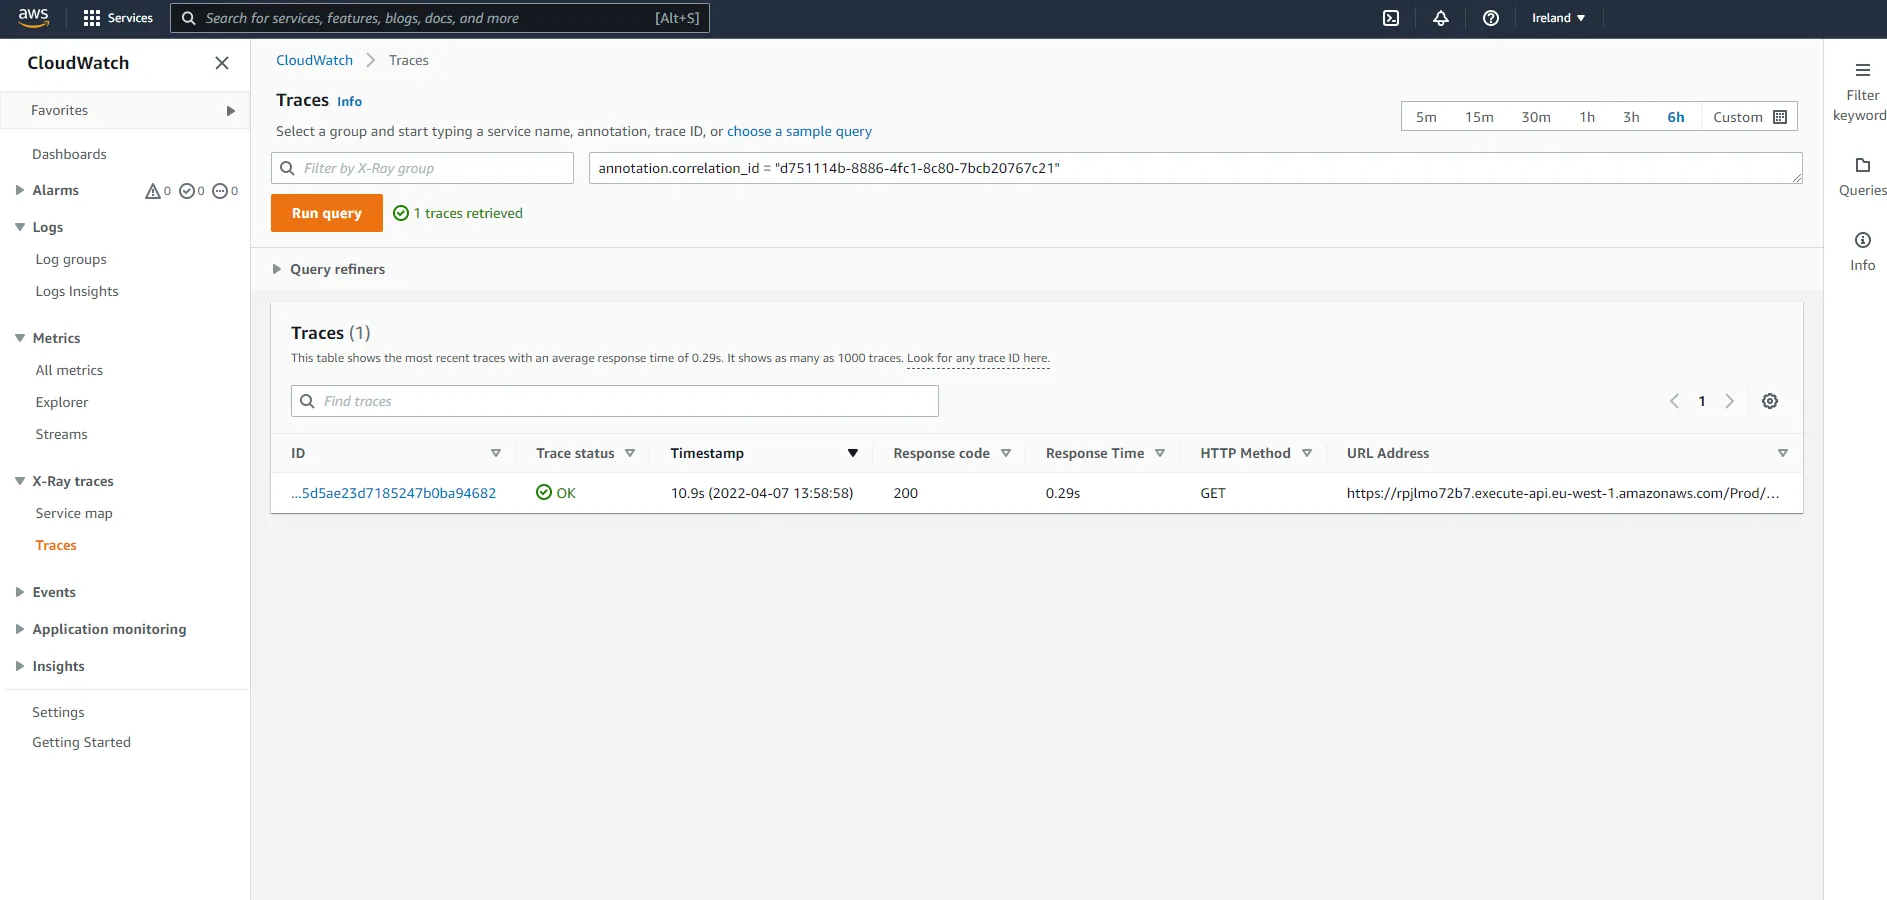
If you want to find traces for a specific ID, you can use the query functionality in the console.
Conclusion
That’s all for now. Hopefully, you have learned a thing or two about how you can use the Lambda Powertools library to implement best practices when it comes to observability for FastAPI applications (and Lambda functions in general). AWS CloudWatch and AWS X-Ray are wonderful tools to help you analyze and monitor serverless applications. Lambda Powertools makes it incredibly easy to start using those services, allowing you to focus on your application logic while leaving the implementation of metrics, logs, and traces to the library.