
Consolidate your Lambda Logs in CloudWatch
1. Introduction
Many advocate for third-party observability providers such as DataDog, ElasticSearch, Lumigo, and others. But sometimes, the built-in tools are all you need. In AWS, this would be CloudWatch.
CloudWatch has a few advantages, such as:
- It’s built-in, so you don’t need to integrate with a third-party provider.
- It works out-of-the-box with most AWS services, such as Lambda and API Gateway.
It does come with a few disadvantages, though:
- Cross-account is still a bit of a hurdle, and cross-region is even more so.
- Searching across a large number of log groups can be painful.
Previously, each Lambda Function would create its own log group. For larger Serverless applications, this can result in hundreds or thousands of different log groups. A few weeks ago, AWS announced a new feature to solve this problem: Advanced logging controls for AWS Lambda.
The release introduces three new capabilities for Lambda functions:
- Built-in support for JSON formatted logs.
- Support to send logs to a custom log group.
- Ability to control the log level on application and system logs.
In this blog post, we’ll look at how this can help improve the observability of Serverless applications.
2. Sample Application
For illustration, I have created a sample application comprising:
- 1 API Gateway (HTTP API).
- 1 Lambda function to handle the API Gateway request.
- 1 EventBridge Bus.
- 25 Lambda functions to handle the EventBridge events.
Whenever a request is made to the API Gateway, the first Lambda function will send an event to EventBridge. This event will include a random integer between 1 and 25. Each Lambda function connected to the bus listens to events containing a specific integer.
All Lambda functions use Powertools for AWS Lambda (TypeScript) to output structured logs. Each function also randomly fails to generate error logs.
The API Gateway has been configured to use the following access log format:
{ "message": "Method: $context.httpMethod | Path: $context.path | Status: $context.status", "service": "sst-demo-aggregated-logs", "httpMethod": "$context.httpMethod", "path": "$context.path", "status": "$context.status", "protocol": "$context.protocol", "responseLength": "$context.responseLength", "requestTime": "$context.requestTimeEpoch", "requestId": "$context.requestId", "endpointRequestId": "$context.awsEndpointRequestId"}3. The Struggles of the Past
Without the new logging controls, let’s take a look at how we can query the logs for this application.
Hard to find the correct log group(s)
Let’s head over to Logs Insights so we can query across our entire application.
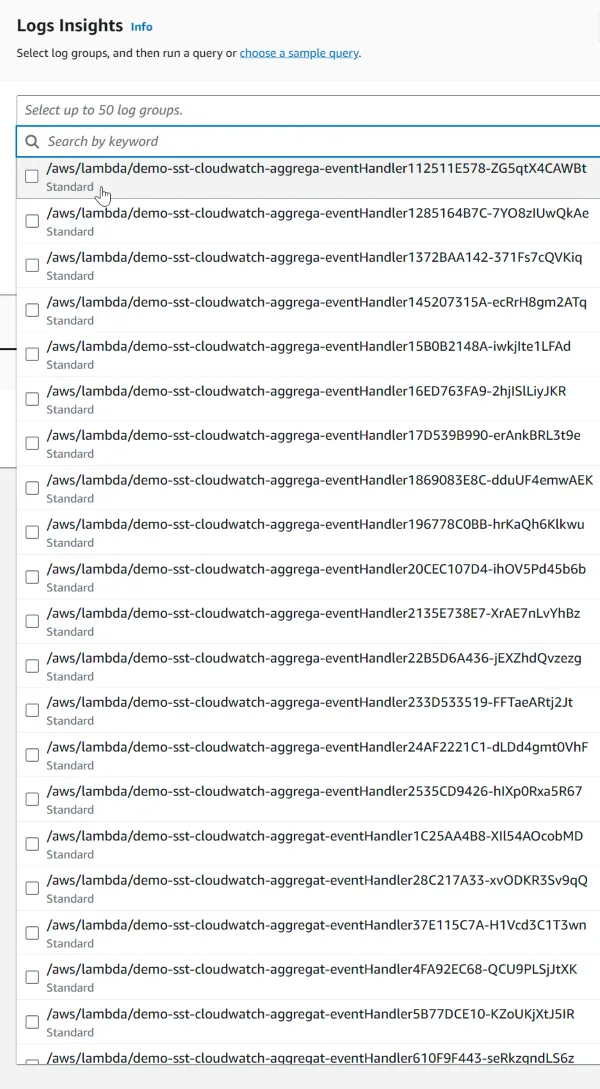
Just select all log groups related to the application. Easy, right?
Now imagine if you have hundreds of functions. Take notice of the Select up to 50 log groups message. This means that you cannot query across all logs if you have more than 50 Lambda functions in your application.
A mix of text and structured logs
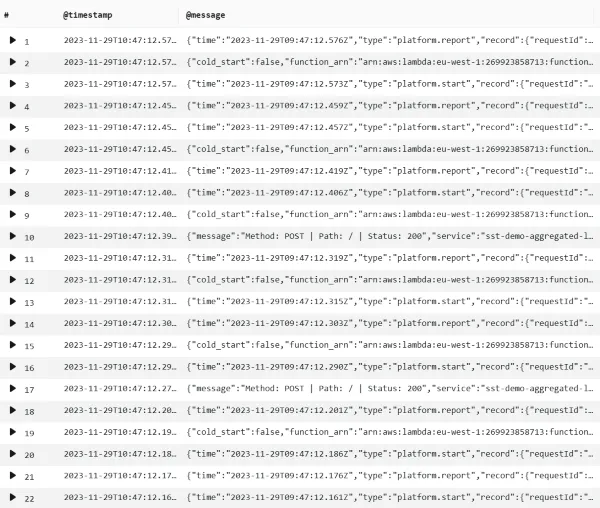
After having selected all applicable log groups, we can start querying the logs. When displaying all logs, we quickly notice that many logs have different formats.
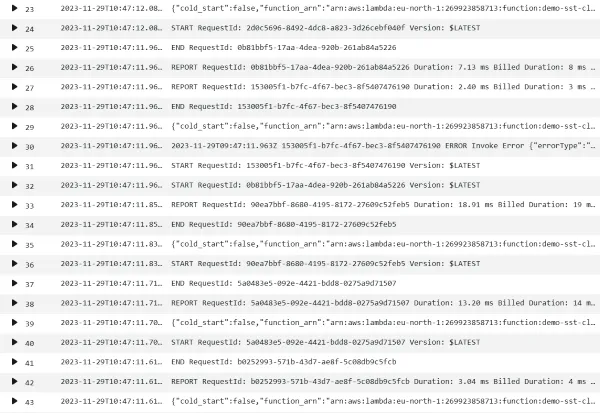
In the above picture we can see a couple of different formats:
START,END, andREPORTlogs. These are system logs from the Lambda service. Especially theREPORTlogs can be useful to see execution time and memory usage.- Our structured application logs, formatted by Powertools for Lambda.
- An error log from an unhandled exception (row 30). These include a stack trace.
4. A Brighter Future
The new advanced logging controls feature solves both of the above problems. Let’s take a look at how.
On the configuration pane for a Lambda function, you can now configure the new logging controls. Here, I have specified a custom log group and set the format to JSON.
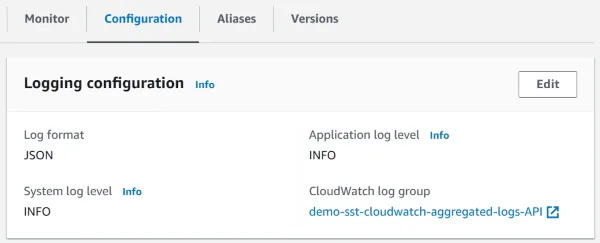
In the sample application, all Lambda functions and the API Gateway access logging have been configured to use the same log group.
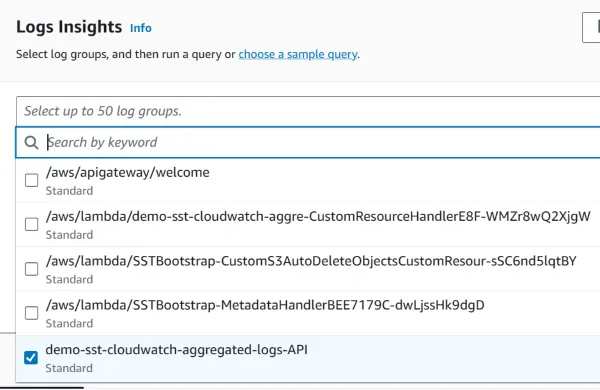
One log group to rule them all
Now, instead of having to select all log groups, we can select the lone log group for our application:
No more unstructured logs
When querying the logs, we can now see that all logs are formatted as JSON:
Let’s take a look at some of the different log formats for non-application logs.
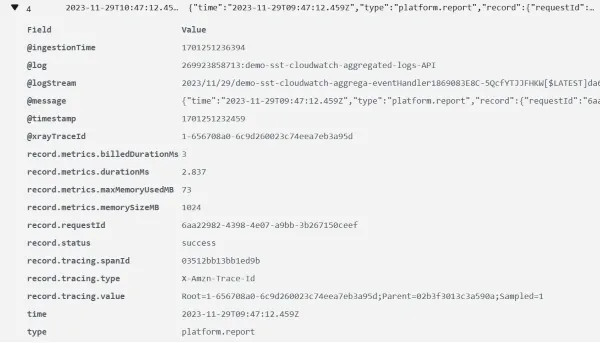
System logs
Below is an example system log. This is the equivalent of the REPORT log entry seen in the previous section.
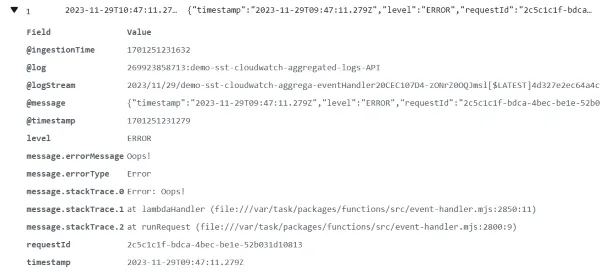
Error logs for unhandled exceptions
Below is an example error log for an unhandled exception.
5. Lets get querying
With all logs now being structured and in the same log group, lets take a look at a few sample queries.
Application logs
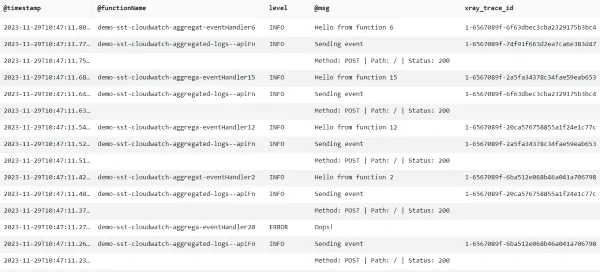
The above shows a combination of the API Gateway access logs and the application logs. You can quickly see the the level and message, as well as X-Ray trace ID and the function name where applicable.
API Gateway and Xray
The reason for not having any Xray trace IDs for the API Gateway logs is that HTTP APIs doesn’t support X-Ray at the time of writing.
This result is achieved with the following query:
fields @timestamp, @functionName, level, @msg, xray_trace_id| parse @logStream /\d{4}\/\d{2}\/\d{2}\/(?<@functionName>.*?).{21}\[/| parse @message /("message"|"errorMessage"):"(?<@msg>[^"]*)"/| filter ispresent(@msg)| sort @timestamp desc| limit 100Here, we are using parse to create extracted fields @functionName and @msg.
When using a custom log group for Lambda functions, each individual function will have its own log stream(s), which includes the function name. The query uses this to extract the function name from the log stream.
Powertools puts log messages in the message field. As seen in Error logs for unhandled exceptions, the error message is in the errorMessage field. The query tries to extract either the message or errorMessage into the computed @msg field.
In this query, we are not interested in system logs. Therefore, we filter out any log entries that do not have a @msg field.
We get is a nice overview of all access and application logs in our service. Consolidating to a single log group makes it easy to scale to hundreds of functions.
Billed duration per function
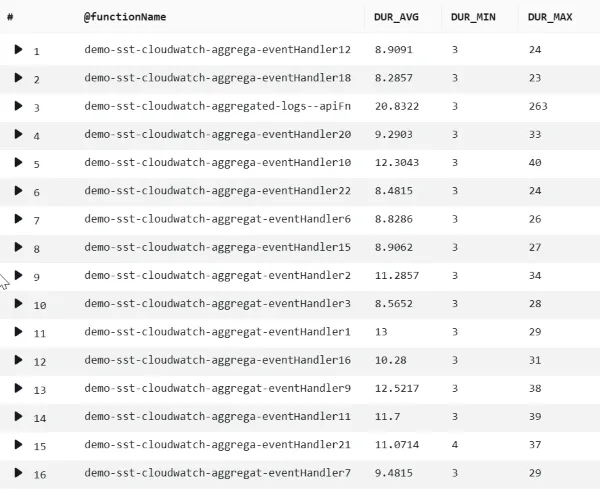
The above shows the average, minimum, and maximum billed duration per function. This result is achieved with the following query:
parse @logStream /\d{4}\/\d{2}\/\d{2}\/(?<@functionName>.*?).{21}\[/| filter type = 'platform.report'| stats avg(record.metrics.billedDurationMs) as DUR_AVG, min(record.metrics.billedDurationMs) as DUR_MIN, max(record.metrics.billedDurationMs) as DUR_MAX by @functionNameAgain, we extract the @functionName from the @logStream field. We then filter out all log entries that are not of type platform.report and use stats to compute the durations for each function.
Number of errors per function
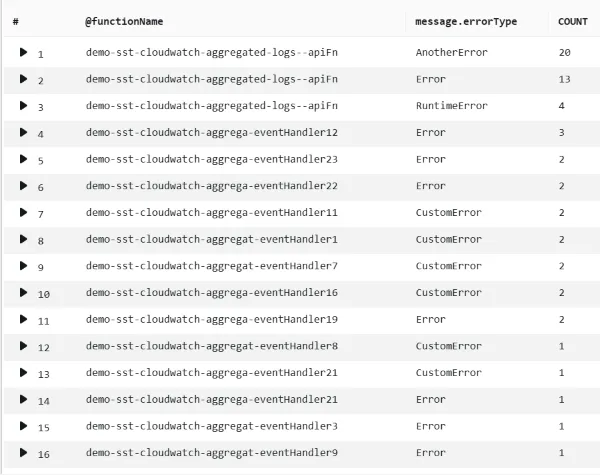
The above shows the number of different errors per function. This result is achieved with the following query:
parse @logStream /\d{4}\/\d{2}\/\d{2}\/(?<@functionName>.*?).{21}\[/| filter level = 'ERROR'| stats count(*) as COUNT by @functionName, message.errorType| sort by COUNT desc6. Conclusion
In this blog post, you have seen how painful it can be to query logs across a large number of Lambda functions. But it doesn’t have to be. With the newly released advanced logging controls, you can now consolidate all your Lambda logs into a single log group.
With one simple configuration change, you can take a big step towards better observability of your Serverless applications.